Download
1 / 11
120 likes | 263 Views
Violations of Assumptions In Least Squares Regression. Standard Assumptions in Regression. Errors are Normally Distributed with mean 0 Errors have constant variance Errors are independent X is Measured without error. Example X s and OLS Estimators. “t” is used to imply time ordering.

E N D
Standard Assumptions in Regression • Errors are Normally Distributed with mean 0 • Errors have constant variance • Errors are independent • X is Measured without error
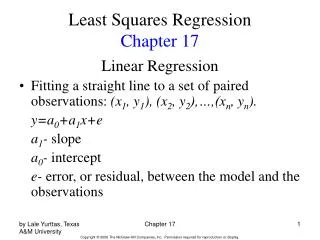
Example Xs and OLS Estimators “t” is used to imply time ordering
Errors = (Gamma(2,3.7672)-7.3485) • Yt = 50 + 10Xt + (et-7.35) = b0*+b1Xt+et* • E(et*) = 0 V(et*) = 27 Based on 100,000 simulations, the 95% CI for b1 contained 10 in 95.05% of the samples. Average=9.99887, SD=0.3502 Average s2(b1) = 0.1224804
Non-Constant Error Variance (Heteroscedasticity) • Mean: E(Y|X) = b0 + b1X = 50 + 10X • Standard Deviation: sY|X = X + 0.5 • Distribution: Normal
Non-Constant Error Variance (Heteroscedasticity) Based on 100,000 simulations, the 95% CI for b1 contained 10 in 92.62% of the samples. Average=9.998828, SD = 0.467182 Average s2(b1) = 0.1813113 < 0.2184
Correlated Errors Example: s2= 9, r=0.5, n=22
Correlated Errors Based on 100,000 simulations, the 95% CI for b1 contained 10 in 84.56% of the samples. Average=10.00216, SD=0.3039251 Average s2(b1) = 0.0476444 < 0.092157
Measurement Error in X • Z=True Value of Independent Variable (Unobserved) • X=Observed Value of Independent Variable • X=Z+U (Z can be fixed or random) • Z, U independent (assumed) when Z is random • V(U) is independent of Z when Z is fixed
Measurement Error in X Based on 100,000 simulations, the 95% CI for b1 contained 10 in 76.72% of the samples. Average=9.197568, SD=0.6076758 Average s2(b1) = 0.4283653 >> (0.20226)2