Download
1 / 38
380 likes | 485 Views
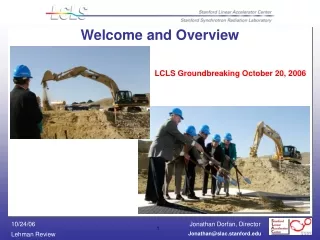
EU FP6 Integrated Project CARBOOCEAN ”Marine carbon sources and sinks assessment” 5 th Annual & Final Meeting – Solstrand Hotel Norway 5-9 October 2009. Welcome and Overview

E N D
EU FP6 Integrated Project CARBOOCEAN ”Marine carbon sources and sinks assessment” 5th Annual & Final Meeting – Solstrand Hotel Norway 5-9 October 2009 Welcome and Overview CARBOOCEAN (30 minutes)
EU Integrated Project CARBOOCEAN – Marine carbon sources and sinks assessment, 35 partners, 50 groups, Europe, Morocco, USA, Canada, IOC/IOCCP, 2005-2009 www.carboocean.org
Overall goal and mission CARBOOCEAN IP (= CarboOcean Integrated Project) aims at an accurate scientific as-sessment of the marine carbon sources and sinks within space and time. It focuses on the Atlantic and Southern Oceans and a time interval of -200 to +200 years from now. CARBOOCEAN determines the ocean’s quantitative role for uptake of atmospheric carbon dioxide (CO2), the most important manageable driving agent for climate change. CARBOOCEAN creates scientific knowledge, which is essential to a quantitative risk/uncertainty judgement on the expected consequences of rising atmospheric CO2 concentrations. Based on this judgement, it will be possible to guide the development of appropriate mitigation actions, such as management of CO2 emission reductions within a global context (e.g., Kyoto Protocol, United Nations, 1997; post-Kyoto negotiations). CARBOOCEAN combines the key European experts and scientific resources in the field through an integrated research effort.
System dynamics Boundary conditions Objective 4: Assessment of feedbacks Objective 2: Long term assessment Objective 3: Assessment of Regional European Contribution Objectives of CARBOOCEAN IP Guiding sustainable development management CO2 emissions Objective 5: Prediction, future assessment Initial conditions Objective 1: Short-term assessment
Core Theme 1: North Atlantic and Southern Ocean CO2 air-sea exchange Core Theme 2: Detection of decadal-centennial Atlantic and Southern Ocean carbon inventory changes Kick-Off Meeting Final Workshop Over-arching activity: Prediction Core Theme 3:Carbon uptake and release at European regional scales Core Theme 4: Biogeochemical feedback on the oceanic carbon sinks Over-arching activity: Long-term assessment Over-arching activity: Short-term assessment Core Theme 5: Future scenarios for marine carbon sources and sinks 0 19 37 55 60 Month Description Nowcast and Synopsis and Understanding Phase: Prediction Sustainment
Expression of Interest: PI meeting (ca. 20 persons) in Amsterdam April 2002 EoI ”MARCASSA” June 2002 Marine carbon sources and sinks assessment
Bergen October 2003 submission of stage 1 proposal among 30 out of 300 proposals Paris January 2004 writing meeting with core theme leaders Bergen February 2004 submission of stage 2 proposal no. 4 out of 30/300 July 2004 – start of negotiations January 1, 2005 – start of CARBOOCEAN
Travel effort for proposal preparation: Ca. 130 x 1000 EUR = 130,000 EUR expenses + equiv. 1 person year 90,000 EUR Person effort for proposal preparation: min. 1.5 person year for 130,000 EUR Meeting costs, advisor costs: 50,000 EUR 400,000 EUR costs invested only for the writing and negotiation of the proposal.
Results beyond the state of the art – a selection: Air-sea carbon fluxes are regionally considerably more variable as previously thought. A North Atlantic carbon observing system has been built up which delivers high accuracy basin-wide air-sea CO2 flux measurements In considerable areas of the Atlantic and the Southern Ocean the surface CO2 partial pressure has increased faster than that in the atmosphere – this potential decrease in CO2 sink must be observed further The pH value of seawater is sinking (time series measurements, surface and deep). Model results show consequences of ocean acidification at the ocean floor. Mesocosm experiments show the reaction of ecosystems for sinking pH. Cutting edge global surface ocean CO2 (most comprehensive in the world!) and Atlantic 3-D carbon data syntheses have been carried out with international colleagues. Future scenarios on show that the carbon cycle re-enforces climate change (positive feedback). Emission targets need to be adjusted accordingly.
Core theme 1 - North Atlantic and Southern Ocean CO2 air-sea exchange on a seasonal-to-interannual scale SOCAT – Surface Ocean CO2 Atlas World largest CO2 database: covers 2150 cruises over 40 years > 7,5 million CO2, > 10 million temperature, > 9 million salinity measurements Quality controlled by regional experts using state-of-the-art technology All data is available in the same format for the first time which is essential for science related to climate research! International effort coordinated by UNESCO/IOCCP Data worth > 20 million Euros can be used to it’s full potential SOCAT will allow a more accurate estimation of the ocean CO2 sink and it’s variability
Core theme 2 - Detection of decadal-to-centennial ocean carbon inventory changes CARINA - Carbon dioxide in the Atlantic Ocean Data rescue project for deep sea carbon dioxide and nutrients data Data with an estimated value of > 50 million Euros was rescued Largest high quality dataset of the entire Atlantic Ocean (188 cruises with approx. 16.000 stations) Will allow for improved estimates of ocean carbon inventory and transport Collaborative effort between US and EUROPE
Core theme 3 - Carbon uptake and release at European regional scale Huertas et al. (2009)
Core theme 4 - Biogeochemical feedbacks on the oceanic carbon sink Heinze, pers. Communication (talked to myself…)
Core theme 5 - Future scenarios for marine carbon sources and sinks Tjiputra, Assmann, Bentsen et al.
CarboOcean‘s and CarboEurope‘s outreach project „CarboSchools“ 60 European schools, 65 projects, 1450 pupils, x teachers, x scientists… • Experimentation projects • Processing scientific data • Field trips and expeditions • Observation and measurements Volbers et al.
EU publication Joint effort of marine and terrestrial carbon research community http://cordis.europa.eu/fetch?CALLER=PUBL_LIB_FP6&ACTION=D&DOC=1&CAT=PUBL&QUERY=0120470ebee7:cc11:5add4443&RCN=200910237
CarboOcean Info-film Univisjon and many helping hands
(Barrett, 2005) 7.2 μm 4.3 μm 15 μm
Anthropogenic forcing Perturbation of Global Carbon Budget (1850-2006) 2000-2006 fossil fuel emissions 7.6 Source deforestation 1.5 CO2 flux (Pg C y-1) atmospheric CO2 4.1 Sink land 2.8 ocean 2.2 Time (y) Le Quéré, unpublished; Canadell et al. 2007, PNAS
Anthropogenic forcing Perturbation of Global Carbon Budget (1850-2006) 2000-2006 fossil fuel emissions 7.6 Source deforestation 1.5 CO2 flux (Pg C y-1) atmospheric CO2 4.1 Sink land 2.8 Variability ranges?? ocean 2.2 Time (y) Le Quéré, unpublished; Canadell et al. 2007, PNAS
2006 2005 Anthropogenic forcing Raupach et al., 2007, PNAS, additions by P.Canadell
CO2 is most important and managable agent of human induced climate change: ”How much CO2 is leaving the atmosphere where and when?” ”What is going to happen – what forcing?” ”Not leaving the world view to others!” Water column inventory of man made CO2 for year 1994 mole m-2 Sabine et al., Science, 2004
Integrated CO2 uptake: 1750-1994, ca. 50% of human-produced emissions Annual CO2 uptake at present: 25% of human-produced emissions ONLY! Water column inventory of man made CO2 for year 1994 mole m-2 Sabine et al., Science, 2004
The ocean carbon sink is regionally more variable than previously thought! Watson, Schuster et al., UEA Schuster et al. (2009) DSR II
Air-sea CO2 flux changes also in Southern Ocean! Sink decrease inferred from observations and modelling ! obs. atm. CO2 + ocean impulse response uptake From: LeQuéré et al., 2007, Science, Saturation of the Southern Ocean CO2 sink due to recent climate change daily NCEP forcing constant 1967 forcing
TCO2 from a model (HAMOOC4) Pre-industrial 1990 2004 Atlantic Ocean
The actual TCO2 and the anthropogenic TCO2 have completely different patterns. Only the ”actual” can readily be observed.Oceanic antropogenic CO2 is tiny on huge background.
Challenge: the net fluxes are also tiny on background of huge gross fluxes IPCC AR4, ch. 7, modified from Sarmiento and Gruber, 2006, with changes in pool sizes from Sabine et al., 2004a
WHAT TO DO NEXT? Key processes – identification & quantification Sustained observations – follow the non-steady state Calibrated models – train models with memory of the past and present Tell policy makers the most feasible pathway for mitigation
Odum‘s analogue: space ship Earth Apollo 17, NASA