Download
1 / 39
390 likes | 467 Views
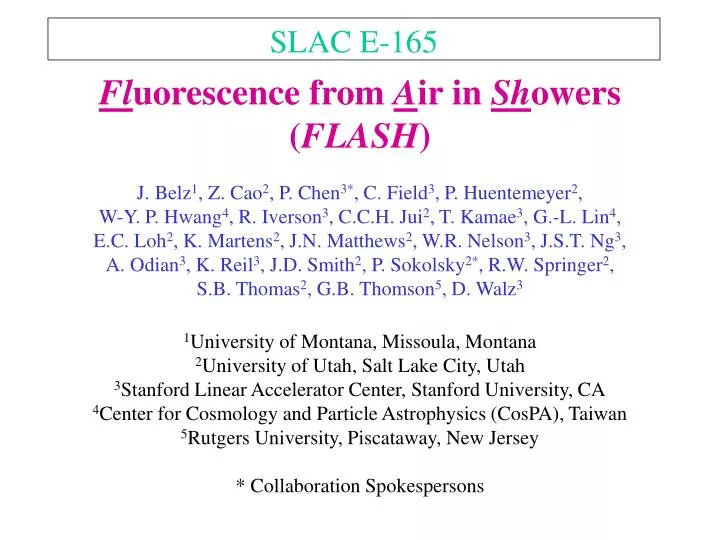
SLAC E-165. Fl uorescence from A ir in Sh owers ( FLASH ) J. Belz 1 , Z. Cao 2 , P. Chen 3* , C. Field 3 , P. Huentemeyer 2 , W-Y. P. Hwang 4 , R. Iverson 3 , C.C.H. Jui 2 , T. Kamae 3 , G.-L. Lin 4 , E.C. Loh 2 , K. Martens 2 , J.N. Matthews 2 , W.R. Nelson 3 , J.S.T. Ng 3 ,

E N D
SLAC E-165 Fluorescence from Air in Showers (FLASH) J. Belz1, Z. Cao2, P. Chen3*, C. Field3, P. Huentemeyer2, W-Y. P. Hwang4, R. Iverson3, C.C.H. Jui2, T. Kamae3, G.-L. Lin4, E.C. Loh2, K. Martens2, J.N. Matthews2, W.R. Nelson3, J.S.T. Ng3, A. Odian3, K. Reil3, J.D. Smith2, P. Sokolsky2*, R.W. Springer2, S.B. Thomas2, G.B. Thomson5, D. Walz3 1University of Montana, Missoula, Montana 2University of Utah, Salt Lake City, Utah 3Stanford Linear Accelerator Center, Stanford University, CA 4Center for Cosmology and Particle Astrophysics (CosPA), Taiwan 5Rutgers University, Piscataway, New Jersey * Collaboration Spokespersons
MEASURING FLUORESCENCE AT SLAC • Extensive Air Showers (EAS)are predominantly a superposition of electro-magnetic (e+, e-, gamma) sub-showers. • Important N2 transition (2P) not accessible by proton excitation; only e-beam can do it. • Final Focus Test Beam (FFTB) beam-line provides energy equivalent showers from ~1015 to ~1020 eV. • 108-1010 electrons/pulse at 28.5 GeV.
The SLAC LINAC The SLAC Accelerator: 3 km long with a klystron approx every 13 m. Delivers up to 50 GeV of e- or e+. Beam Switchyard: T461 located in the FFTB
The FFTB A 28.5 GeV e- beam is delivered to the FFTB. At the final focus beam cross section is 1 m wide and < 0.1 m high. At T461 location beam is mm scale. Pulse length is pico-second scale. Energy spread is 0.1%. Repetition rate is 10 Hz (occasionally 1 Hz and 30 Hz).
OBJECTIVES • Spectrally resolved measurement of fluorescence yield to better than 10%. • Investigate effects of electron energy. • Study effects of atmospheric impurities. • Observe showering of electron pulses in air equivalent substance (Al2O3) with energy equivalents around 1018 eV.
PROGRAM • Gas Composition • N2/O2 dependence, and Ar, CO2, H2O impurities • Pressure Dependence • Yield versus Pressure down to 10 torr • Energy Dependence • Yield versus electron energy distribution down to 100keV • Fluorescence Spectrum • Resolve individual bands using narrow band filters or spectrometer. • Pulse Width • Pressure dependence of fluorescence decay time for each spectral band
Thin Target Thick Target Beam 2% 2.2% Showering - 3% Detector System 5.4% 5.4% Optical System 4% 6.5% Total 7% 9.2% SYSTEMATIC ERROR BUDGET
THIN TARGET EXPERIMENT • Thin target stage requires the 28.5 GeV beam to deliver 108-109 e- per pulse. • Pressure variations • Fluorescence Spectrum • Linearity of fluorescence with beam charge. • Impurities.
THIN TARGET AIR CHAMBER LEDs PMTs
THICK TARGET EXPERIMENT • Thick target stage requires the 28.5 GeV beam to deliver 107-108e- per pulse. • The layers of Al2O3must be remotely moveable to allow changing of shower depth observed. • Shower depth variations. • N2/O2 variations. • Fluorescence spectrum.
Test Run (T461) in June 2002 J. Belz1, Z. Cao2, P. Chen3*, C. Field3, P. Huentemeyer2, W-Y. P. Hwang4, R. Iverson3, C.C.H. Jui2, T. Kamae3, G.-L. Lin4, E.C. Loh2, K. Martens2, J.N. Matthews2, W.R. Nelson3, J.S.T. Ng3, A. Odian3, K. Reil3, J.D. Smith2, P. Sokolsky2*, R.W. Springer2, S.B. Thomas2, G.B. Thomson5, D. Walz3 1University of Montana, Missoula, Montana 2University of Utah, Salt Lake City, Utah 3Stanford Linear Accelerator Center, Stanford University, CA 4Center for Cosmology and Particle Astrophysics (CosPA), Taiwan 5Rutgers University, Piscataway, New Jersey
LED PMT Test Run Equipment: Thin Target Chamber, 2 PMT’s with calibration pulsed LED, wide-band filter, digital scope for pulse-shape recording.
My Summer Vacation • two weeks of data taking over three weeks in June 2002 (3 days at Monterey Bay, 2 in SF!) • 707 “runs” each with between 2500 to 5000 recorded ‘events’: 2 million recorded ‘events’ • gas fillings: air, nitrogen, air-nitrogen mixtures, ethylene • pressures between 3 and 760 torr • readout from two PMTs • ran in “parasitic” mode: we get whatever beam characteristics the primary user wants
Surprise ! • Observed an unexpected non-linear enhancement in the PMT signal. • Non-linearity was seen in both air and nitrogen
Effect was enhanced at low pressures and was reduced near sea-level pressure
What’s Going on? • Nobody knows…it’s a “New” result! This is where it gets to be “FUN!” (Definition: Physics…kinda like “fun”…only different) • Let’s take a simplistic look at what’s happening with the beam: • Each pulse is ~ 1mm in size (the focusing magnets were off…else it would be focused down to ~1 mm in the transverse dimension)
I get to play (bad) “phenomenologist” • Beam pulse passes in ~ 3 picoseconds • Treat pulse as a uniform ball of charge and estimate impulse Δp it imparts on an electron (and hence the kinetic energy gained ΔEK : • Δp ~ Ne2/4pe0r2 ּ Δt (r ~ 1 mm) • ΔEK =(Δp)2/2m ~ 700 eV for N=1010 IF the “ejected” electron does not suffer collisions while being accelerated…this is enough energy to cause “secondary ionization” • Important quantity here is the “Mean Free Path” λ.
Mean Free Path • The value ofshould depend (inversely) on: • cross sectional area of the molecule (~1/πR2 unit: m-2) • density of molecules (~ 1/n: unit: m3) • From dimensional analysis: expect λ ~ 1/(n πR2) • “exact” calculation gives λ = 1/(1.404n πR2) for point-particle - molecule collisions (replace R by D for molecule-molecule)
Mean Free Path • At room temperature in air/nitrogen, we have λ = 2x10⁻⁴/P λ in meter, P in torr
Mean Energy Gained(before collision) • Estimate the energy gained by an electron before collision: ΔEK ~ Ne2/4pe0 × [ 1/r - 1/(r+λ) ]
CAVEAT EMPTOR • Seems like we can understand the non-linearity from a very simplistic model • PRBLEM: it is TOO simplistic…we have neglected the enormous magnetic field carried by the beam pulse…the combination leads to “plasma excitations”…better leave it for the “real” theorists (who are now salivating over this result)
Whew... • Fortunately the non-linearity went away when the beam charge was reduced to below ~ 1x10⁹ electrons/pulse • My vacation was saved!!!
How does this compare with earlier measurements? • Kakimoto et.al, • Nucl. Inst. And • Meth. A372 527 • (1996) • Preliminary result • from this test run • @ 28.5 GeV: • 5-6 photons • per m per e-
But... • This is rather amazing…it looks as if for most of the lower atmosphere (up to 15km) the fluorescence yield (in air) is roughly independent of pressure!!!!! • But the density of molecules is proportional to pressure… • What is going on?
Collisional De-excitation • It appears that collisions can also de-excite molecules (in addition to “emission”) • From the result…oxygen is very effective at de-exciting…addition of 21% oxygen to nitrogen decreases yield by a factor ~8 at near sea level pressure • Key quantity is “mean” time between collisions τ
Mean Collision Time τ • Expect τ ~ λ/vmean • For an ideal gas: vmean ~ (3kT/m)1/2 • Nitrogen at room temperature vmean ~ = 450 m/s • Compare to mean emission time of ~50 ns
Summary • Don’t forget U. of Utah holds the World’s Record for the highest energy particle ever seen • Always question “how do we know this?”…most of the time you end up learning about how measurements are made • FLASH experiment had a very successful test run and made an unexpected discovery • Many aspects of these results can be explained by simple kinetic theory.
Undergrad and Highschool Students Who Worked on FLASH • Undergrads: • Ben Jones • Ryan Snow • Gary Burt • Cigdem Ozkan • Highschool: • Melissa Maestas • Justin Findlay • Jason Thomas