Download
1 / 26
260 likes | 260 Views
This study explores the estimation of surface-atmosphere exchange at regional scales through the use of observational and modeling techniques. The aim is to validate land-surface models, estimate parameters, investigate catchment-scale hydrology, and validate carbon budgets.

E N D
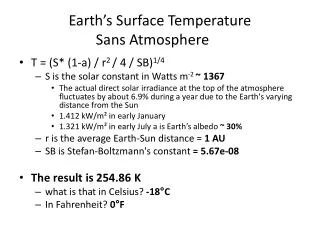
Estimating Surface-Atmosphere Exchange at Regional Scales Peter Isaac1, Ray Leuning2 and Jörg Hacker3 1 School of Geography and Environmental Science, Monash University 2 CSIRO Marine and Atmospheric Research 3 Airborne Research Australia, Flinders University of South Australia
What Does The Title Mean? • Surface-Atmosphere Exchange • fluxes of momentum, heat, H2O and CO2 • Regional Scales • of the order of 100 km • bigger than patch scale • accessible by micro-meteorological techniques • smaller than continental scale • accessible by inversion techniques
Why Do We Want Regional Scale Fluxes of H2O and CO2? • Validation of land-surface models (LSMs) • Estimation of parameters for LSMs at regional scales • avoids some of the issues in scaling-up • Investigation of catchment scale hydrology • Validation of inventory-based carbon budgets
What Was OASIS? • Observations At Several Interacting Scales • multi-organisation experiment • held near Wagga Wagga, New South Wales • intensive field campaigns in October 1994 and 1995 • 1994 was a severe drought year, not used • 8 flux towers, G109 research aircraft, free-flying and tethered balloon systems, FTIR spectrometer, TDL, flask samples, LandSat imagery
OASIS 1995 • Wagga Wagga to Urana • 100 km transect • ~1 mm/km rainfall gradient • paired flux towers at 3 locations • aircraft to provide link from patch to regional scale
Aircraft Flight Patterns Paddock Grid Transect
Tower-Aircraft Comparison Paddock Flights • Low level allows comparison of means, variances and covariances • Correction for temperature sensor response time • Correction for surface heterogeneity reduces mean bias to: • 7 Wm-2 for Fh • -7 Wm-2 for Fe
Observing Regional Scale Fluxes • No single observation technique available that covers all temporal and spatial scales • flux towers • direct measurement with good temporal but poor spatial coverage • aircraft • direct measurement with good spatial but poor temporal coverage • remote sensing • indirect measurement with good spatial and good temporal coverage
Modelling Regional Scale Fluxes • Limitations of modelling only approach • need regional-scale values for model parameters • often known at leaf or patch scale but not regional • need regional-scale values for fluxes to validate model • often only available at patch scale • models incomplete or approximations
Best Of Both Worlds • Combine observational and modelling techniques to use strengths of each • direct measurement (towers or aircraft) of fluxes used to infer surface properties • interpolation of surface properties over region using remotely sensed data • use surface properties in a model to estimate regional scale fluxes
Surface Properties • Evaporative fraction, E • Maximum stomatal conductance, gsx • Bowen ratio, • Water use efficiency, WUE
Assumptions • Combined approach uses 2 assumptions applicable in well-watered situations at time scales of several days • temporal evolution of fluxes is primarily driven by diurnal and synoptic trends in meteorology • solar radiation, temperature, humidity, wind speed • spatial variation in fluxes is primarily driven by heterogeneity in surface properties • stomatal conductance, soil moisture, roughness
Constraints • Combined approach is subject to 2 constraints • bulk meteorological quantities show good spatial (point to point) correlation • meteorology at a single location can be used for a region (tile approach in GCMs) • surface properties show little (ideally no) diurnal variation • measurement of surface property at any time during day is representative of whole day
Diurnal Trend • E and gsx show small diurnal variation at most sites • shows large diurnal variation • WUE mixed
Spatial Variability • Good agreement between aircraft and tower measurements • Spatial variability consistent with rainfall gradient • E, gsx, and WUE all show some variation with synoptic conditions
Remote Sensing : NDVI LandSat 7 ETM Lack of FC measurements at Urana will bias regional FC based on tower data
Source Area Weighted NDVI • L = -30 m • u* = 0.5 ms-1 • z0 = 0.03 m • WD = 20 deg 80% ~ 18,000 m2 Horst & Weil, 1992 etc 80% ~ 216,000 m2
Surface Properties and NDVI E = 1.7*NDVI - 0.7 r2=0.73 gsx = 57*NDVI + 34 r2=0.66 = -6*NDVI + 6 r2=0.75 WUE = -36*NDVI + 22 r2=0.85
Push Forward To Fluxes • Interpolate gsx and WUE across region using linear relationship to NDVI • Use bulk meteorology (FA, S, D, Ta, u) from central location (Browning) plus interpolated surface properties to estimate regional FE • FH calculated as FH = FA - FE • FC calculated as FC = WUE x FE
Comparison With Observations • Daily averages of FE, FH and FC • Modelled values from gsx and Penman-Monteith equation • FE under-predicted at Wagga Wagga and over-predicted at Urana • FC under-predicted at Wagga Wagga
Comparison Of Techniques • Obs is average of sites • gsx-PM is combined approach • ICBL is integral convective boundary layer approach (Cleugh et al 2004) • DARLAM/SCAM is coupled mesoscale/LSM (Finkele et al, 2003)
Limitations • Daytime only • Relationship between surface properties and NDVI is empirical • Site and time specific • WUE relationship not strong • Soil moisture not included • Effect of soil moisture on surface conductance is passed on to estimate of gsx (or E)
Consequences • Variation of gsx (or other surface properties) along transect is an artifact of not including soil moisture • NDVI is a strong function of Lai and Lai is a strong function of soil moisture • Relationship between gsx (or other surface properties) and NDVI is likely to be a consequence of neglecting soil moisture