Download
1 / 28
280 likes | 394 Views
A Remote Sensing Approach for Estimating Regional Scale Surface Moisture. Luke J. Marzen Associate Professor of Geography Auburn University Co-Director AlabamaView. Research funded by Alabama Water Resources Research Institute. AmericaView Membership.

E N D
A Remote Sensing Approach for Estimating Regional Scale Surface Moisture Luke J. Marzen Associate Professor of Geography Auburn University Co-Director AlabamaView Research funded by Alabama Water Resources Research Institute
http://www.geosociety.org/meetings/06drought/factsheet.pdf • Maintain and enhance hydrologic and meteorologic data collection capabilities and existing data sets, and develop new data sets needed to improve assessments. Automate data collection to the maximum practical extent, and collect data at the frequency and spatial scale needed to support model analyses and decision-making. Fully fund and implement the National Integrated Drought Information System (NIDIS) passed by Congress in 2006.
Estimated that drought costs US $6-8 billion annually (Wilhite, D.A. and M.D. Svodoba. 2000)
Meteorological drought is usually measured by how far from normal precipitation has been over a period of time. • Agricultural drought occurs when soil moisture is insufficient to meet crops’ needs to produce an average crop. It may occur in times of average precipitation depending on soil types. • Hydrological drought refers to deficiencies in surface and subsurface water supplies.
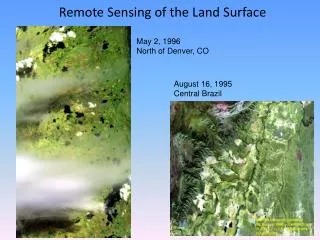
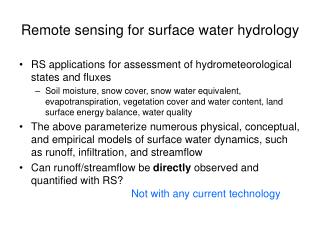
Objective • Evaluate an approach to estimate surface moisture conditions using remote sensing at the regional scale • Scale methods down to field level
Vegetation and EMR • small bodies in leaf that contains chlorophyll • Absorbs blue and red light, reflects green and NIR
Normalized Difference Vegetation Index • (Red – NIR)/(Red + NIR) • Values 0-1
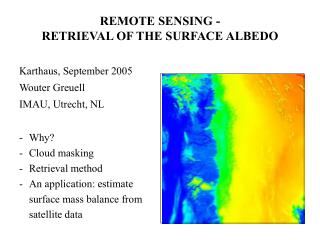
Land Surface Temperature • Thermal RS
Past research using AVHRR has exploited the relationship between the Normalized Vegetation Index and Land Surface Temperatures to evaluate surface moisture status (Nemani and Running, 1989)
LST NDVI LST NDVI LST and NDVI relationship • During drier periods NDVI values fall and vegetation canopy temperatures increase Drier conditions Less dry LST - Land Surface Temperature NDVI – Normalized Difference Vegetation Index
Data and Methods -Use NDVI and LST MODIS products -growing season of 2000-2003 -Evaluate ratio of NDVI/LST as an indicator of surface moisture -compare to ground-based indices
The MODIS Instrument Moderate Resolution Imaging Spectroradiometer • Global coverage - 2330 km swath • 36 channels - 2 @ 250m pixels, 5 @ 500m, 29 @ 1km • various levels of processing • EOS Validated products • MOD13, MOD11
EOS DataGateway Land Validation Home Site Direct to PI Websites http://modis.gsfc.nasa.gov/cgi-bin/texis/organigram/weblinks
MOD13 • NDVI composites uses “best value” • Both 250m and 1km
MOD11 Land Surface Temperature • Shown to be accurate within 1 degree K • Averaged 2 8 day composites to match NDVI
Crop Moisture Index • Southeast Regional Climate Center • Mean CMI was compared to the mean of NDVI/LST on a Climate division basis • NDVI • LST
Table 1. Pearson's Product Correlations for Remotely sensed variables with CMI
NDVI/LST CMI N=46 r = 0.79** **significant at .001 Period 4 for entire southeast
Conclusions • The ratio of NDVI/LST may provide an effective indicator of surface moisture conditions • LST performed substantially better in our three year study
Future work • Economic Study • local scale/field level
Atlas thermal sensor 1m resolution High crop yield = red Cool temps = red *not done by this geographer