Download
1 / 32
320 likes | 466 Views
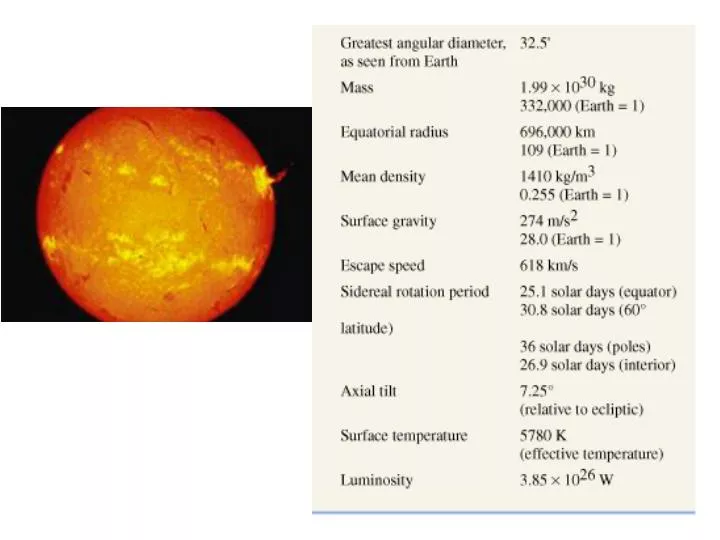
Solar Structure The main regions of the Sun, not drawn to scale, with some physical dimensions labeled. Solar Oscillations

E N D
Solar Structure The main regions of the Sun, not drawn to scale, with some physical dimensions labeled.
Solar Oscillations The Sun has been found to vibrate in a very complex way. By observing the motion of the solar surface, scientists can determine the wavelength and the frequencies of the individual waves and deduce information about the solar interior not obtainable by other means. The alternating patches represent gas moving down (red) and up (blue). (b) Depending on their initial directions, the waves contributing to the observed oscillations may travel deep inside the Sun, providing vital information about the solar interior. (National Solar Observatory) Lacking any direct measurements of the solar interior, astronomers
Solar Interior Theoretically modeled profiles of density (b) and temperature (c) for the solar interior, presented for perspective in (a). All three parts describe a cross-sectional cut through the center of the Sun. Figure 16.5 shows the solar density and temperature according to
Solar Convection Physical transport of energy in the Sun’s convection zone. We can visualize the upper interior as a boiling, seething sea of gas. Each convective loop is about 1000 km across. The convective cell sizes become progressively smaller closer to the surface. (This is a highly simplified diagram; there are many different cell sizes, and they are not so neatly arranged.)
Solar Granulation Photograph of the granulated solar photosphere. Typical solar granules are comparable in size to Earth’s continents. The bright portions of the image are regions where hot material is upwelling from below. The dark regions correspond to cooler gas that is sinking back down into the interior. (Big Bear Solar Observatory) Figure 16.7 is a high-resolution photograph of the solar surface. The
Figure 16.8 Solar Spectrum A detailed spectrum of our Sun shows thousands of Fraunhofer spectral lines which indicate the presence of some 67 different elements in various stages of excitation and ionization in the lower solar atmosphere. The numbers give wavelengths, in nanometers.(Palomar Observatory/Caltech)
. Figure 16.9 Spectral Line Formation Photons with energies well away from any atomic transition can escape from relatively deep in the photosphere, but those with energies close to a transition are more likely to be reabsorbed before escaping, so the ones we see on Earth tend to come from higher, cooler levels in the solar atmosphere. The inset shows a close-up tracing of two of the thousands of solar absorption lines, the “H” and “K” lines of calcium at about 395 nm.
Solar Chromosphere This photograph of a total solar eclipse shows the solar chromosphere, a few thousand kilometers above the Sun’s surface. (G. Schneider) THE CHROMOSPHERE
Figure 16.11 Solar Spicules Short-lived narrow jets of gas that typically last mere minutes, spicules can be seen sprouting up from the solar chromosphere in this Ha image of the Sun. The spicules are the thin, dark, spikelike regions. They appear dark against the face of the Sun because they are cooler than the solar photosphere. (NOAO)
Solar Corona When both the photosphere and the chromosphere are obscured by the Moon during a solar eclipse, the faint corona becomes visible. This photograph shows clearly the emission of radiation from the solar corona. (G. Schneider)
Solar Atmospheric Temperature The change of gas temperature in the lower solar atmosphere is dramatic. The minimum temperature occurs in the chromosphere. Beyond that, the temperature rises sharply in the transition zone, finally leveling off at around 3 million K in the corona. The cause of this extensive electron stripping is
Sunspots This photograph of the entire Sun, taken during a period of maximum solar activity, shows several groups of sunspots. The largest spots in this image are over 20,000 km across—twice the diameter of Earth. Typical sunspots are only about half this size.(Palomar Observatory/Caltech) Sunspots, Up Close (a) An enlarged photograph of the largest pair of sunspots in Figure 16.15. Each spot consists of a cool, dark inner region called the umbra, surrounded by a warmer, brighter region called the penumbra. The spots appear dark because they are slightly cooler than the surrounding photosphere. (b) A high-resolution, true-color image of a single sunspot shows details of its structure as well as much surface granularity surrounding it. The spot is about the size of Earth. (Palomar Observatory/Caltech; National Solar Observatory
Sunspot Rotation The evolution of some sunspots and lower chromospheric activity over a period of 12 days. The sequence runs from left to right. An H filter was used to make these photographs, taken from the Skylab space station in 1975. An arrow follows one set of sunspots over the course of a week as they are carried around the Sun by its rotation. (NASA)
Solar Magnetism (a) Sunspot pairs are linked by magnetic field lines. The Sun’s magnetic field lines emerge from the surface through one member of a pair and reenter the Sun through the other member. The leading members of all sunspot pairs in the solar northern hemisphere have the same polarity (labeled N or S, as described in the text). If the magnetic field lines are directed into the Sun in one leading spot, they are inwardly directed in all other leading spots in that hemisphere. The same is true in the southern hemisphere, except that the polarities are always opposite those in the north. The overall direction of the magnetic field reverses itself roughly every 11 years. (b) A far-ultraviolet image taken by NASA’s Transition Region and Coronal Explorer (TRACE) satellite in 1999, showing magnetic field lines arching between two sunspot groups. Note the complex structure of the field lines, which are seen here via the radiation emitted by superheated gas flowing along them. Resolution here is about 700 km. In this negative image (which shows the lines more clearly), the darkest regions have temperatures of about 2 million K. (NASA)
Solar Rotation The Sun’s differential rotation wraps and distorts the solar magnetic field. Occasionally, the field lines burst out of the surface and loop through the lower atmosphere, thereby creating a sunspot pair. The underlying pattern of the solar field lines explains the observed pattern of sunspot polarities. If the loop happens to occur on the limb of the Sun and is seen against the blackness of space, we see a phenomenon called a prominence, described in Section 16.4.
Sunspot Cycle (a) Annual number of sunspots throughout the twentieth century, showing the five-year average of the annual data to make long-term trends more evident. The (roughly) 11-year solar cycle is clearly visible. At the time of solar minimum, hardly any sunspots are seen. About four years later, at solar maximum, as many as 100–200 spots are observed per year. The most recent solar maximum occurred in 2000. (b) Sunspots cluster at high latitudes when solar activity is at a minimum. They appear at lower latitudes as the number of sunspots peaks. Finally, they are prominent near the Sun’s equator as solar minimum is again approached.
Maunder Minimum Number of sunspots occurring each year over the past four centuries. Note the absence of spots during the late seventeenth century. Is Solar Luminosity Related to Sun Spot Numbers?
Solar Prominences (a) This particularly large solar prominence was observed by ultraviolet detectors aboard the SOHO spacecraft in September, 1999. (b) Like a phoenix rising from the solar surface, this filament of hot gas measures more than 100,000 km in length. Earth could easily fit between its outstretched “arms.” Dark regions in this TRACE image have temperatures less than 20,000 K; the brightest regions are about 1 million K. The ionized gas follows the solar magnetic field lines away from the Sun. Most of it will subsequently cool and fall back to the photosphere. (NASA)
Solar Flares (a) Much more violent than a prominence, a solar flare is an explosion on the Sun’s surface that sweeps across an active region in a matter of minutes, accelerating solar material to high speeds and blasting it into space. (b) A flare occurs when hot gas breaks free of the magnetic field confining it and bursts into space. This composite image shows a dark sunspot group (visible light), the surrounding solar photosphere (ultraviolet, shown in red here) and a collection of magnetic loops (extreme ultraviolet, colored green here) confining million-degree gas a few minutes before a major flare in June 2000. (c) This remarkable image, obtained by the TRACE satellite, shows an active region shortly after a flare. The green “slinky spring” is actually an arcade of many magnetic field lines arching through the Sun’s lower atmosphere roughly from top to bottom, confining hot gas as the Sun’s magnetism reestablishes control. (NASA)
Time scale for contraction under gravity: ~30 Myrs Time scale for hydrostatic adjustment: ~1 hr
Convective layer: When the adiabatic lapse rate is too large in the Radiative Equilibrium Model, convection takes over. In the atmosphere this is the troposphere, but in the star it is the outer 200,000 km.