Download
1 / 61
610 likes | 800 Views
Regional Climate Change and Vegetation Water Relations in Inner Mongolia Lessons Learned within “ Effects of Land Use Change on the Energy and Water Balance of the Semi-Arid Region of Inner Mongolia, China ” NASA’s NEESPI. Nan Lu. Landscape Ecology and Ecosystem Science (LEES) Lab

E N D
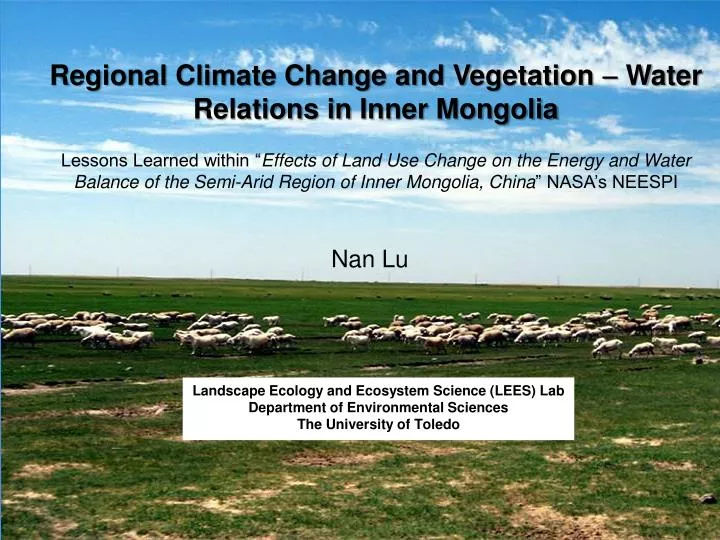
Regional Climate Change and Vegetation Water Relations in Inner Mongolia Lessons Learned within “Effects of Land Use Change on the Energy and Water Balance of the Semi-Arid Region of Inner Mongolia, China” NASA’s NEESPI Nan Lu Landscape Ecology and Ecosystem Science (LEES) Lab Department of Environmental Sciences The University of Toledo
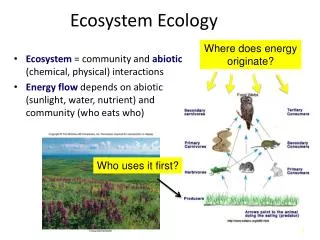
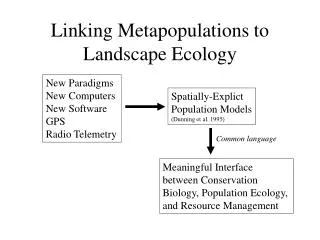
Introduction • The global climate has changed rapidly in the past century with the global mean temperature increased by 0.7 C (IPCC, 2007). • Studies on how climate change drives changes in ecosystem processes (carbon, water, energy cycles, etc.) and their feedbacks are the current scientific frontiers (Lucier et al., 2006). • It requires multiple techniques and analyses to understand these scale-dependent interactions and provide scientific foundation to policymakers.
Research Context of My Studies • The Northern Eurasia Earth Science Partnership Initiative (NEESPI), has been initiated by the NASA Land Use and Land Cover Change program (LULCC) to understand the feedbacks between climate, land surface processes and anthropogenic activities in Eurasia at latitudes > 40N. • LEES Lab focused on • “The Effects of Climate and Land Use Change on the Energy and Water Balance of the Semi-Arid Inner Mongolia”.
37°01’ - 53°02’ N 95°02‘ - 123°37' E Study Region: Inner Mongolia (IM) Area: 1.18 million km2 Elevation: 86 - 3352 m Annual mean air temperature: 4˚C Annual precipitation: 308 mm 2.9˚C, 450mm 2.6˚C, 350mm Sub-humid 6.8˚C, 200mm Semi-arid Olson et al., 2001, John et al., 2008 Arid
IM has experienced a significant land cover change during the last decades , due to climate change and anthropogenic influences related to population increase and socio-economic development (Zhang 1992; John et al. submitted). • However, the changes in hydrological and energy processes in this regions under the frame of climate and land cover changes have not been well studied.
My research as part of the proposed activities to quantify the water and energy cycles in IM (within the LEES-NASA project). * Study 4 * Study 1, 2 * Study 3
Rationale of My Dissertation To evaluate the long-term change of climate at regional, biome and local scales. Chapter 2: Study One Meteorological Records To examine the spatial and temporal variability of climate extremes and the dependency on biogeographical features. Chapter 3: Study Two Spatial Interpolation To examine the dynamics of the major components of water balance and their interactions in three paired ecosystems. Chapter 4: Study Three Eddy-Covariance (EC) To evaluate the soil moisture-vegetation relationship at a large scale and develop empirical models for soil moisture downscaling. Chapter 5: Study Four Remote Sensing Products
Study One Climate Change in Inner Mongolia from 1955 to 2005 – Trends at Regional, Biome and Local Scales
The rates of climate change are usually different among regions due to the varied land surface properties interacting with the climate in different ways (Meissner et al., 2003; Snyder et al., 2004; Dang et al., 2007). IM divides into three biomes: forest, grassland and desert (Olson et al., 2001), and each biome has different natural and anthropogenic ecology. However, how the climate change varies among the biomes in IM has not been investigated. Introduction to Study One
Objective To examine the climate changes over the past 50 years ( i.e., 1955-2005) at regional, biome and local scales, with a particular focus on the differences among the biomes.
Methods • Climatic variables: • Mean, max, min air temperature (Tmean, Tmax, Tmin) • Diurnal temperature range (DTR) • Vapor pressure deficit (VPD) • Precipitation (PPT) • Data source: • 51 meteorological stations • China Meteorological Data • Sharing Service System • Data analysis: Least square linear regression to examine the long-term trends • T-test with repeated procedure (i.e., year repeated) to • examine the differences between decadal means (10) (23) (18)
Region Forest Grassland Tmean Tmin DTR VPD PPT Desert Year Regional Climate Change and the Variations among the Biomes * means that the slope is significant. Capital letters A, B and C refers to the slope differences among biomes (p < 0.05)
Decadal Change of the Region Arrows represent significant increasing or decreasing trends of a decade comparing to its proceeding one (p < 0.05).
a) Rate of change in Tmean (˚C) /10yr c) Rate of change in DTR (˚C) /10yr 0 -0.16 – -0.34 -0.37 – -0.59 -0.76 – -0.90 0 0.01 – 0.34 0.35 – 0.52 0.54 – 0.71 b) Rate of change in Tmin (˚C) /10yr d) Rate of change in VPD (kPa) /10yr 0 0.008 – 0.024 0.025 – 0.036 0.055 – 0.061 0 0.16 – 0.53 0.56 – 0.69 0.74 – 1.00 Spatial Variability Solid circle means the trend is not significant (p > 0.05); open circle of different sizes means the differences in the rate of changes.
Conclusions • IM has changed to a warmer and drier environment over the period of 1955-2005, with grassland and desert biomes experiencing stronger changes as compared to the forest biome. • The changes in the climate varied significantly by location and over time.
Study Two Temporal and Spatial Variability of Climate Extremes in Inner Mongolia from 1955 to 2005
Introduction to Study Two • Climate extremes are often the most sensitive measures of climate change (IPCC 2001). • Climate extremes can produce much stronger influences on ecological, societal and economic processes than means do (Katz et al., 1992; Beniston and Stephenson, 2004). • However, our knowledge of the temporal and spatial variations in climate extremes is still not as conclusive as mean climate conditions.
Objectives • To evaluate the variations in the climate extremes in time and space in IM. • To detect the differences in the long-term trends of climate extremes among the three biomes (i.e., forest, grassland and desert); • To examine the inter-decadal variations and shifts in space; • To explore the dependency of the spatiotemporal changes on geographical features such as latitude, longitude, and elevation.
MethodsExtreme Climate Indices Frich et al. (2002)
Statistical Analysis • Least square linear regression to examine the long-term changes. • T-test with repeated procedure to examine the differences in the indices among decadal means. • Repeated regression analysis to examine the relationships between the magnitudes/trends of the indices and geographical features. • Spatial interpolations in selected indices using the method of regularized spline with tension (RST).
Region ETR FD GSL WN HWDI Forest R Grassland A B B A B Desert F A A B A A G A A A A A D Year Temporal Changes at Regional and Biome Scales - ETI *means that the slope is significant. Capital letters A, B and C indicate the slope differences among biomes (p < 0.05)
Region CDD RR1 SDII R5d R75 Forest R Grassland Desert F G D Year Temporal Changes at Regional and Biome Scales - EPI *means that the slope is significant(p < 0.05).
Spatial Variation of Trends - ETI 36↑, 15↓ 0↑, 51↓ 49↑, 2↓ 51↑, 0↓ 49↑, 2↓ Circle size indicates the magnitude of the rate; black diamond indicates a significant change at p<0.05.
Spatial Variation of Trends - EPI 24↑, 27↓ 15↑, 36↓ 31↑, 20↓ 20↑, 31↓ 14↑, 37↓ Circle size indicates the magnitude of the rate; black diamond indicates a significant change at p<0.05.
Geographical Influences on Climate Extremes Magnitude vs. longitude, latitude & elevation Trendvs. longitude, latitude & elevation * p< 0.05, ** p<0.001, *** p<0.001. • Longitude gradient (from east to west): the warm and dry extremes increased; the cold and wet extremes decreased. • Latitude gradient (from south to north): warm extremes decreased; cold extreme increased. PPT days increased and PPT density decreased. • Elevation: similar to latitude
Conclusions The hot extremes have increased and the cold extremes have decreased in IM in the past 50 years. The most significant changes occurred in the grassland and desert biomes. The dry or wet extremes had no significantly changes in the region, with high temporal and spatial variability and inconsistent differences among the biomes. With increasing longitude, the climate was getting warmer and drier; with increasing latitude or elevation, the climate was getting colder. The precipitation days increased but precipitation density decreased. The trends in the extreme indices were mostly independent of the geographical gradients.
Potential Effects of Climate Change on the Ecosystems in IM • The warming and drying climate may affect ecosystems in various aspects in IM, such as reducing vegetation production and crop yield (Hou et al., 2008), reducing biodiversity (John et al., 2008) and aggravating desertification (Gao et al., 2003). • Ecosystem processes (land cover change) and climate feedbacks: For example, a positive feedback between the warming-drying climate and decrease in ecosystem carbon storage.
Study Three Evapotranspiration and Soil Moisture Dynamics in Three Paired Ecosystems in Semi-arid Inner Mongolia
Introduction to Study Three • In semi-arid and arid regions, evapotranspiration (ET) is the dominant component of water balance (Kurc and Small, 2004; Huxman et al., 2005). • Precipitation pulses control the dynamics of ET and the physiological responses of plants (Noy-Meir, 1973; Schwinning and Sala, 2004).
Cultivation and grazing are the two representative anthropogenic disturbances in IM. • Trees are naturally distributed only in the scattered areas with shallow groundwater in the semi-arid IM, but poplars were planted as fast-growing woods to combat desertification in IM. • The disturbances (or land cover change) are expected to alter ET, vertical distribution of soil water, and ET-soil water interactions due to the changes in species composition, vegetation cover and soil properties (Grayson and Western, 1998; Zhang and Schilling, 2006).
Objectives • To evaluate the effects of three types of anthropogenic disturbances on: • the magnitude and temporal dynamics of ET; • the interaction between ET and soil water content; • the relative contribution of soil water storage (S) from different soil layers to ET. • I hypothesize that cultivation, grazing and tree plantation have significant influences on the water cycles due to the changes in vegetation and soil properties.
Ecosystem-based Observations in Three Paired Sites Kubuqi Poplar Plantation (Kp) K X D Xilinhot Grazed Grassland (Xd) Planted in 2003 Reclaimed from 1970s Xilinhot Fenced Grassland (Xf) Fenced in 1999 Duolun Cropland (Dc) Disturbed vs. natural Kubuqi Shrubland (Ks) Duolun Grassland (Ds)
Methods • Latent heat flux (LE), net radiation (Rn): EC system • Soil heat flux (G): HFT-3 heat plates • Air temperature (Ta) and relative humidity (Rh): HMP45AC probes • Precipitation (PPT): TE525 tipping bucket rain gauge • Wind speed (u): propeller anemometer (CSI) • Volumetric water content (VWC): EasyAC50 probes (at 0-10, 10-20, 20-30, 30-50 cm) • Leaf Area Index (LAI): portable area meter • FAO Penman-Monteith equation: • Water balance: PPT = ET + S + R or PPT – ET = S + R R – water residual
Site Characteristics * upper 20 cm of soil
R2 Ds: 0.55 0.56 Dc: 0.67 0.65 R2 Xf: 0.29 0.62 Xd: 0.05 0.37 R2 Ks: 0.37 0.46 Kp: 0.18 0.05 PPT (mm) ET (mm) PPT-ET (mm) Seasonal Changes of PPT, ET and Water Yield
Cumulative PPT, ET and S Cumulative PPT, ET (mm) Date Cumulative S, R (mm) Date
Effects of VWC on ET and ET/PET All: all observations included, NR: observations during rainy periods excluded
Relative Contribution of ∆Sin Soil Vertical Profile to ET • ∆S from 0-10, 10-20, 20-30, 30-50 cm soil contributed varied percents of water to total ET at different site: • Ds: 40%, 24%, 6%, and 0% (66%) • Dc: 15%, 10%, 5% and 11% (42%) • Ks: 16%, 15%, 6% and 0% (37%) • Kp: 3%, 0%, 0% and 0% (3%) • Xf : 38% (>38%) • Xd: 27% (>27%)
R2=0.72, p<0.01 Correlation Between Root Biomass and Relative Contribution of ∆Sto ET
Pattern of water flow through root system during day and night (Caldwell, 1988). Hydraulic Lift Hypothesis
Cultivation and grazing tended to decrease ecosystem ET of the growing season due to the decreased ∆S in the upper soil layers where the roots were mainly distributed. Poplar plantation increased ET most probably because the poplars accessed the groundwater by the deep roots. Changes in growing length and LAI also accounted for the ET difference between sites. Conclusions
Study Four Downscaling AMSR Soil Moisture Using MODIS Indices in Semi-arid Inner Mongolia
Introduction to Study Four Spatial variability of available soil moisture (Ms) is the key factor influencing vegetation distribution, ecosystem structure, function and diversity (Grayson et al., 1997; Yeakley et al., 1998; Baudena et al., 2007). The precision of current spatial models to simulate carbon, energy and water fluxes are mostly poor due to the lack of spatial Ms data. The errors in Ms estimations contributed substantial uncertainties to model output (Xiao et al., 1997; Zhang et al., 2009).
Point measurements: predominantly developed for applications in agriculture to understand field-scale soil water dynamics, such as time-domain reflectometry (TDR) techniques. Remote sensing technology: developed for understanding the hydrology of land–surface–atmosphere interactions, especially at river basin, continental, and global scales (Kerr et al., 2001). Conventional Methods
Gaps in Ms Database The current techniques of Ms measurement have limitations in providing sufficient spatial resolution or coverage of intermediate scales(Qiu et al., 2000; William et al., 2003; English et al., 2005). It is pertinent to bridge between the Ms measurements and data requirements in ecosystem and regional studies. Advanced Microwave Scanning Radiometer -EOS (AMSR-E) (C band, 6.9 GHz): Global coverage Spatial resolution of 25 km
(1) To evaluate the relationship between AMSR-E derived Ms and MODIS-derived indices in three land use/cover (LULC) types in semi-arid IM; (2) To investigate the capability of MODIS products (500 m or 1000 m) as proxies of AMSR Ms so that finer-resolution Ms can be estimated. Objectives 625 1250
Methods Excluded grids of cropland cover > 60% & NDVI > 0.5 (Jackson, 2002). Class definition: X > 50% of the grid area 25 km LULC NDVI EVI NDSVI LST 1 km
ANOVA with repeated procedure to test Ms differences among LULC types. Non-intercept linear regression analysis between Ms and the grid-mean EVI and NDSVI (VI). Paired t-test for testing the differences of Ms-VI regression slopes. Multivariate stepwise regression: Ms = f (EVI, EVIsd, NDSVI, NDSVIsd, LST, LSTsd) Statistical Analysis
Data Selection 04/28/04 05/11/04 06/18/04 07/22/04 …… • Three Ms images were randomly selected for each month (one for every ten days) from April to October in 2004 (21 in total); • NDVI, EVI, NDSVI and LST products were selected according to the dates of Ms.