Download
1 / 37
370 likes | 527 Views
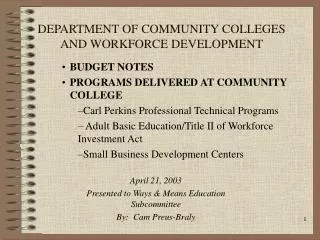
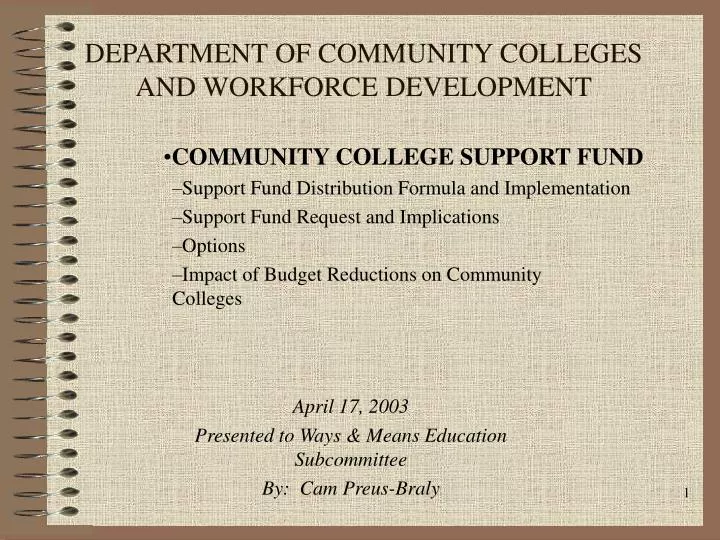
DEPARTMENT OF COMMUNITY COLLEGES AND WORKFORCE DEVELOPMENT. COMMUNITY COLLEGE SUPPORT FUND Support Fund Distribution Formula and Implementation Support Fund Request and Implications Options Impact of Budget Reductions on Community Colleges             . April 17, 2003

E N D
DEPARTMENT OF COMMUNITY COLLEGES AND WORKFORCE DEVELOPMENT COMMUNITY COLLEGE SUPPORT FUND Support Fund Distribution Formula and Implementation Support Fund Request and Implications Options Impact of Budget Reductions on Community Colleges April 17, 2003 Presented to Ways & Means Education Subcommittee By: Cam Preus-Braly
Community College Mission StatutoryORS 341.009 (1) The community college is an educational institution which is intended to fill the institutional gap in education by offering broad, comprehensive programs in academic as well as professional technical subjects. It is primarily designed to provide associate or certificate degree programs for some, serve a transitional purpose for others who will continue baccalaureate or other college work, provide the ability to enter the workforce immediately and serve to determine future educational needs for other students. It can provide means for continuation of academic education, professional technical training or the attainment of entirely new skills as demands for old skills and old occupations are supplanted by new technologies. It may also provide the means to coordinate courses and programs with high schools to enhance the Certificate of Advanced Mastery and to accommodate successful transition to college degree programs.
State Board of Education Policies • The State Board of Education has statutory authority to govern Oregon’s community college districts • As part of that responsibility, the State Board has the authority to develop and implement a formula for the distribution of state resources to fund community colleges • The State Board develops the formula within the policy framework of access and equity
State Board of Education Policies • Access – All Oregonians should have access to community college services regardless of where they live • Equity – Each college should receive the same funding per student • Quality – In January of 2003 adopted a freeze on enrollments to stop the erosion of the dollar value of an FTE
Funding Formula • The passage Ballot Measure 5 in 1991 fundamentally changed the funding of community colleges • Over time, state resources have grown to be the largest share of revenue for local community college districts
Funding Formula • As the State Board and CCWD staff looked to the future, it became apparent that a new formula would need to be adopted • In 1991-93, a temporary formula was enacted in which community colleges received a proportional share of state funds based on past allocations • Early versions of the current funding formula were first adopted in the 1993-95 biennium
Funding Formula Principles • The overarching principles of the new formula were: • Provide equity in the distribution of resources • Provide a base for infrastructure and school size • Equalize property tax revenues per student • Funding follows the student • These principles continue to be reflected in the current funding formula
Funding Formula Implementation • Individual elements within the funding formula have stayed relatively unchanged since its adoption in 1993-95 • 50% of local property taxes are included • A base factor is included to reflect the differences in college size • Full-time equivalent enrollments (FTE) are the basis for distribution following students
Basic Formula Equation plus State Appropriation 50% of Imposed Property Taxes Equals: Total Formula Funds Minus: Base Funding Divided by: Enrollments Equals: Funds per FTE
Future of Funding Formula • In January of 2003 the State Board of Education directed CCWD to work with the Community College Presidents Council to review and recommend a new formula for 2005-07 • Members include: • Wes Channell, Klamath CC, Chair • Mary Spilde, Lane CC • Jess Carreon, Portland CC • Bob Barber, Central Oregon CC • Joe Johnson, Clackamas CC • Travis Kirkland, Blue Mountain CC
College Actual 2001-02 RFTE Rate per Thousand Property Taxes Imposed Taxes per FTE Blue Mountain 2,349.28 $0.6611 3,008,881 $ 1,281 Central Oregon 3,988.99 $0.6204 7,173,672 $ 1,798 Chemeketa 11,637.35 $0.6259 11,298,620 $ 971 Clackamas 7,792.56 $0.5582 9,004,227 $ 1,155 Clatsop 1,715.84 $0.7785 2,517,860 $ 1,467 Columbia Gorge 845.05 $0.2703 317,708 $ 376 Klamath 1,193.83 $0.4117 1,183,902 $ 992 Lane 12,746.88 $0.6191 10,982,571 $ 862 Linn-Benton 6,765.55 $0.5019 4,631,609 $ 685 Mt. Hood 9,467.29 $0.4416 7,378,789 $ 779 Oregon Coast 461.09 $0.1757 716,742 $ 1,554 Portland 24,851.77 $0.2828 18,640,144 $ 750 Rogue 4,939.67 $0.5128 7,031,022 $ 1,423 Southwestern Oregon 3,029.86 $0.7017 3,391,497 $ 1,119 Tillamook Bay 426.20 $0.2636 653,693 $ 1,534 Treasure Valley 1,797.43 $1.2235 1,407,800 $ 783 Umpqua 3,541.33 $0.4551 2,053,736 $ 580 Totals/Averages 97,549.97 $0.5433 91,392,473 $ 937 Property Taxes
Impact of Property Taxes on Distribution of State Resources • No property tax revenues actually leave districts • Including one-half of local property taxes in the formula does affect the amount of state funds that a community college receives • The following chart indicates which colleges gain or lose state funds as a result of property taxes being included in the formula
Impact of Property Taxes on Distribution *Projections based on funding included in Governor’s Budget
Projected State & Property Taxes per FTE – Property Taxes Included in Formula
Projected State & Property Taxes per FTE – Property Taxes Excluded from Formula
State Support for Community Colleges—Historically • Current service plus inflation=biennial allocation • Not reflective of increases in student enrollment • No connection to the actual average cost of serving a student
New Approach to Community College Funding in 2001 • Budget request based on: • conservative projection of student enrollment • statewide average cost to serve a student • Average cost per student derived from national reporting (IPEDS) and college revenue and expenditure reports
2001 Community College Support Fund Appropriation • appropriated $464 million for student enrollment of 192,005 • legislature funded 45.9% of projected cost of community college full-time equivalent students • $32 million, of the $45 million community college enrollment growth appropriation, was lost to state budget reductions
Agency Request 2003-2005 $2,483 2003-05 state share of average cost per student(45% of projected cost) 208,905 multiplied by students(derived from 3% increase in reimbursable FTE per year) $518.75 million .
Columbia 2,884 6.5% Community Colleges Clatsop 5,894 16.3% Multnomah 73,607 11.0% Hood R. 2,373 11.6% Umatilla 7,008 10.0% Wallowa 305 4.3% Wash. 44,531 9.6% Tillamook 3,813 15.5% Sherman 137 7.4% Morrow 815 7.2% Gilliam 98 5.2% Union 582 2.4% Yamhill 6,469 7.4% Clackamas 33,438 9.5% Wasco 2,974 12.5% Polk 5,962 9.4% Marion 35,494 12.2% Wheeler 78 5.0% Baker 755 4.5% Lincoln 4,427 9.9% Jefferson 1,631 8.2% Linn 14,396 13.8% Benton 11,918 14.9% Grant 374 4.8% Crook 1,283 6.4% Lane 37,054 11.3% Deschutes 13,468 10.6% Harney 212 2.8% Malheur 3,859 12.1% Coos 10,655 17.0% Douglas 16,233 16.0% Lake 639 8.6% • CC Students by County • Total Students Enrolled, 2001-02 • % of Population Enrolled Curry 2,330 11.0% Josephine 5,379 3.8% Jackson 7,220 3.8% Klamath 2,836 4.4%
Increased Demand for Highly Skilled Workforce “Oregon’s future will depend on having a critical mass of highly skilled technology workers and researchers.” “We need to immediately retrain existing workers for today’s high demand jobs.” Oregon Council for Knowledge and Economic Development Report, 2002 “The current supply of graduates produced by Oregon’s community colleges and universities falls short of the demand created by new positions and vacancies in these critical shortage fields.” Final Report of the Interim Task Force on Health Care Personnel, 2002
The Capacity Gap • Nursing and Allied Health Programs are full but colleges do not have funds to expand to meet market demand. • Waiting lists for ESL classes • Funding cuts = fewer programs, classes, seats statewide • Physical plants in need of repair or expansion to meet the need for classroom and lab space.
The Capacity Gap Professional Technical Programs are the training ground for a highly skilled workforce. But in 2001-2003 the gap in PT programs grew: 15 AAS Programs were suspended 12 Certificate Programs were suspended 17 AAS Programs were deleted 8 Certificate Programs were deleted
What are the Options? • The “cap”…freezing funding allocations to last year’s levels. • More $$$! • Differentiated Funding • Greater reliance on grant and “other” funds • Cost savings: cut staff, cut programs, cut courses • Tuition Strategies • Raising Tuition • Differentiated Tuition
Tuition/Fees • Tuition increased 12% this year • rates are set by local college boards. • state average yearly tuition and fees for • a full-time in-district student = $2,337 • tuition for 2002-03 ranges from $40-$55 • per credit • Projected average increase next year of 8% or $6.35 per credit for a range of $45 to $60
Community College Tuition 02-03 increase 12% 03-04 projected 8% Student share of their education for the decade 1992 to 2002 increased from 22% to 33%
Socio-Economic Benefits • Return on investment (source: CC Benefits Inc. Study, March 2002) • 17% ROI in Oregon’s Community Colleges. • The state of Oregon benefits from improved health, reduced welfare, unemployment and crime saving the public $61.5 million per year. • Benefits of a community college education (Bureau of Labor Statistics publication) • Increase wages $100 to $400 per week • Decreases likelihood of unemployment by 50%