Download
1 / 69
780 likes | 1.24k Views
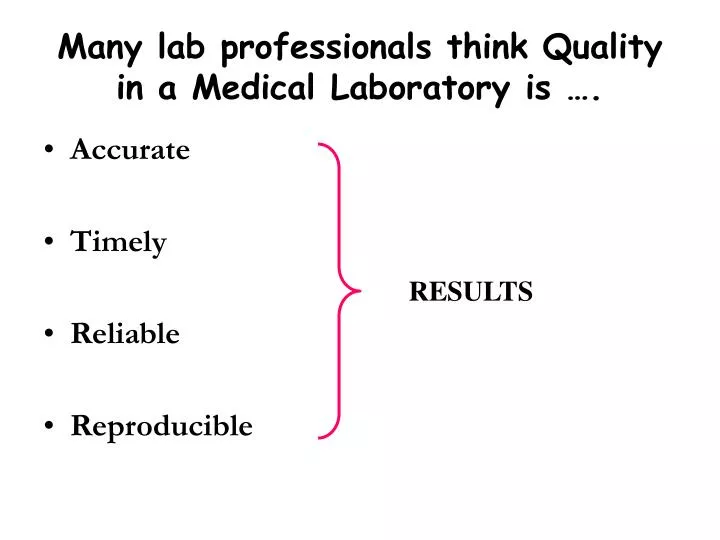
Many lab professionals think Quality in a Medical Laboratory is …. Accurate Timely Reliable Reproducible. RESULTS. INSTITUTE OF BIOCHEMISTRY WELCOMES YOU ALL TO THE CME ON “ QUALITY ASSURANCE IN CLINICAL LABORATORY UP, CLOSE & PERSONAL”.

E N D
Many lab professionals think Quality in a Medical Laboratory is …. • Accurate • Timely • Reliable • Reproducible RESULTS
INSTITUTE OF BIOCHEMISTRY WELCOMES YOU ALL TO THE CME ON “QUALITY ASSURANCE IN CLINICAL LABORATORY UP, CLOSE & PERSONAL”
8 rights make Quality in a Medical Laboratory is …. • Choosing the Right test • Collecting Right Specimen • After Right patient preparation • Testing by the Right method • Reporting the Right based on • Right Reference intervals at the • Right time and at the • Right Price
Quality is …. • A subjective term - for which each person has his / her own definition • Technically Quality can have two meanings • A product or service that fulfills the defined and expected requirement • stated and implied needs • A service or product free from defects & deficiencies
Stages of Quality - Hierarchy QUALITY MANAGEMENT QUALITY SYSTEM QUALITY ASSURANCE QUALITY CONTROL
WHO definition of QA & QC is …. • QA - Includes Internal QC, External QA, pre-analytic phase, test standardization, post-analytic phase, management, and organization (WHO, 1992) • QC - Internal quality control (IQC) – set of procedures for continuously assessing laboratory work and the emergent results; immediate effect, should actually control release of results (WHO, 1981)
Quality Assurance & Quality Control - difference is …. • QA is for correction & prevention of errors or defects in the entire lab • QC is detection of errors and defects in testing process
Purpose of Internal & External QC Internal QC • For CONTINUOUS & IMMEDIATE (DAILY) monitoring of the laboratory work and the emergent results in order to decide whether the results are reliable enough to be released to physicians (WHO, 1981) • Measures Precision & Repeatability of the systems & methods in use in the lab. • Illusion of ‘short term accuracy’ of the lab results. • Do not detect the accuracy or trueness of patient results over a ‘longer term’
Purpose of Internal & External QC External QC • For PERIODIC AND RETROSPECTIVE monitoring of lab results by an independent external agency to indicate to the laboratory and its staff the accuracy or bias in their systems & methods • Lab can know its shortcomings and change their Internal Quality Assurance procedures.
Why EQAS is necessary? • Serves as an educational tool and help to monitor & improve the performance of the lab • Measures the accuracy or bias of its results and stability of methods – Over a longer period of time in terms of years • Mandatory requirement for applicant & accredited labs • Non participation or repeated failures in an EQAS or PT programme may result in temporary suspension or cancellation of accreditation for those non EQAS tests • Gives the laboratories, both the management & technical staff, added confidence in their patient test results
WHAT DOES IT IDENTIFY ? • Identifies systematic kit & reagent problems, water quality problems, analyte calibration stability and status, equipment performance • Indicator of where to direct improvement efforts • Identifies training needs of lab personnel • Benchmarks the lab’s performance against others • Early Warnings System for Problems
HOW SHOULD IT BE USED ? • Should only be used for motivating staff & not to punish them • Inaccurate lab results are not due to technicians • But due to failure of lab systems
HOW SHOULD IT BE USED ? • EQAS / PT samples should be treated exactly as the patient samples Only then the correct situation in the lab can be found fixing the problem becomes easy Never • Run the calibration on the day of reporting EQAS sample if it is not a scheduled /required calibration • Repeat the EQAS samples where as the patient samples are tested only once and give the mean of multiple runs • Ask a specific analyst run the EQAS / PT sample
REMEMBEREQAS …. • SUPPLEMENTS Internal Quality Control • NEVER a SUBSTITUTE for Internal QC • Both measure 2 different aspects of quality
INTERPRETATION OF EQAS REPORTS VIS – Variance Index Score SDI –Standard Deviation Index Z-Score – Classical & Robust
Variance Index Score First proposed by the United Kingdom National Quality Control Scheme (UKNEQUAS) CCV (Chosen Co-efficient of Variation) & DV (Designated Value) used to calculate VIS CCV is just the Allowable Limit of Error for an analyte (TEa) - Sum of both imprecision and bias Set & recommended by WHO after studying the performance of many Indian labs
Calculation of VIS Designated Value [DV] = 120 mg % Participant's result = 95 mg% % Variation [%V] = Participant's Result - Designated value --------------------------------------- X 100 Designated value 120-95 X 100 = 25 X 100 120 120 = 20.8 Variance Index = %V X 100 = 20.8 X 100 = 277 CCV 7.5 VIS = 277
Calculation of VIS How to read the EQAS results ? Check the VIS & OMVIS values for each parameter every month Check if your value is close to DV Closer it is lower will be your VIS & better is your lab’s accuracy Remember If your VIS is < 50 it is regarded and given as zero score Even if >400, it is still given as 400 only
Interpretation of VIS VISPerformance < 100 Very good 100 -150 good 150 -200 satisfactory room for improvement > 200 Not acceptable If VIS of >200 on two or more occasions for the same analyte, them check your standardization procedures & calibration Indicates an accuracy problem (systematic error / bias )
Interpretation of VIS Check the monthly OMVIS.(Overall Mean VIS) cumulative performance over a period OMVIS Performance < 100 Very good - your result are very close to DV 150-200 Need to take care of those parameters for which the reported values are very different from the DV for that particular method > 250 You are probably reporting many wrong results & you should take urgent steps to locate the problem and correct them
Calculation of VIS – Method Mean The ‘Method Mean' - Mean obtained from results of all participating labs following the same method including results of outliers The ‘Designated Value’ is the value obtained after excluding results, from labs with same method, which are > 3SD of Method Mean and recalculating the mean after eliminating the outliers - Mean of ‘inliers only’ The 'Reference Mean' - Mean obtained at the organizing lab after exposing the QC samples to ambient temperature (25-35 C) for a period of 7- days (transport time) and analysing them on five different days The reference mean is shown against the method by which it was analysed in the organizing lab
Mean value obtained at the Reference Lab (CMC) after exposing 5 vials to ambient Temp. for 9 days and analyzing them on 5 diff. days
Mean value obtained at the Reference Lab (CMC) after exposing 5 vials to ambient Temp. for 9 days and analyzing them on 5 diff. days
Mean value of results from of all participating labs with same method
Value given (DV) is the mean of all participating labs for that method after excluding results from labs outside 3SD of the Mean Value (of the participating labs with the same method)
STANDARD DEVIATION INDEX Another Statistical tool – assigned to the lab by the EQAS / PT provider on the performance of the lab for each analyte in a EQAS cycle A measure of relative inaccuracy / relative bias
What is normal or Gaussian distribution ? Out of 100 results 68.2% of values fall within ± 1SD 95.5% of values fall within ± 2SD 99.7% of values fall within ± 3SD
IS KNOWING SDI USEFUL ? Yes - A measure of the result around a mean among a group of values Since 95 % of all results in a normal population fall within ± 2 SDs of the mean, +2 SD is considered an acceptable laboratory value Expressed in the units being measured
IS KNOWING SDI USEFUL ? The number of Standard Deviations that your lab’s mean differs from the Peer Group Mean . Difference is converted into SD units (SDI) The SDI indicates how large / small the difference is between your result and target value Simply said ‘Difference between your result and group mean in terms of the number of standard deviations from the overall mean’
IS KNOWING SDI USEFUL ? Actual magnitude of the difference in the units of the test may look too small or too large To figure the actual size of this inaccuracy / bias in concentration units, you need to multiply by the actual SDI by of the group SD. For e.g if the group mean is 102 mg/dL for TGL and group SD is 5 mg/dL and your SDI score is 1.2 Actual quantitative difference is 1.2 x 5 = 6 mg/dL
IS KNOWING SDI USEFUL ? Any SDI of 2.0 or greater in a EQAS cycle for any analyte deserves special concern – indicates some for of systematic error Any test whose average SDI is 1.0 or greater deserves some special attention because your method shows a systematic difference from the group. Likely to lead to unacceptable results in future SDI up to 1.0 – your performance is satisfactory – your result is with 1 SD of the group – you are with in the 68.7 % of lab’s result whose values are close to mean
IS KNOWING SDI USEFUL ? if you observe SDIs such as -0.4, -0.2, -0.5 - 0.5, - 0.5 and -1.0 (all negative) for an analyte in successive cycles, your method is generally running on the low side and is negatively biased, on average, by +0.6 SDI You are reporting precise pateint values but lower than the true value by 0.6 SD () So better calibrate your instrument and analyte or requires instrument maintenance
Z-Score Classical Z Score – same as SDI Can be used for internal quality control also
Z-Score Robust Z score statistic is used when the distribution of results of participating labs is not Gaussian (not ‘normally’ distributed) and there are varied results / outliers Both accuracy and precision (repeatability as well as reproducibility) are assessed in terms of robust Z score - both within and between labs Z score (ZB & ZW) The participant labs are asked to analyse the same sample TWICE and submit both results to the EQAS provider
Z-Score Robust Z score = Normalised Lab’s result- Median result of all labs ) Normalized IQR ( Inter Quartile Range) It is calculated based on the “median” value (central value) and the ‘interquartilerange’ All results from participating labs are arranged in an ascending manner (lowest to highest) the central value is taken as the median The 25th and 75th percentile values are calculated The ‘interquartile range is the difference between the 75th & 25th percentile The 25th quartile (Q1) is the value below which a quarter of the results lie. Similarly, the 75th quartile (Q3) is the value above which a quarter of the results lie. IQR = Q3 - Q1 Normalized inter quartile range (NIQR): NIQR = IQR x 0.7413 (a constant)
Z-Score The between laboratory Z-score (ZB) = (S - median ) / (IQR x 0.7413) S = (A + B)/[square root of (2)] = standardised sum of the two results for a laboratory (where A and B are results of two samples of the same test). Within laboratory Z-score (ZW) = (D- median / (IQR X 0.7413) D = (A - B)/[square root of (2)] = standardized difference between the two results for a laboratory While testing two specimens in an EQAS / PT programme by a lab performance both ZW and ZB should be considered simultaneously for assessing the performance
Z-Score Interpretation of Robust Z-scores: Z score less than 2 - Satisfactory Z score 2 but less than 3 - Questionable perfromanceZ score more than 3 – Unsatisfactory Both ZB & ZW should be < 2 Using only one Z-score may misleading ZW < 2 ZB > 2 = Higher bias i.e low reproducibility ZB < 2 ZW > 2 = low precision (i.e., low repeatability) For assessing laboratory's technical competency, both ZW and ZB value should be low at the same time.
EXERCISES ON INTERPRETATION OF EQAS REPORTS Dr.V.K.Ramadesikan
Why Analysis of EQAS reports is important ? True benefit of EQAS /PT proficiency testing, lies in carefully & critically evaluating your results and report Proper analysis of EQAS testing results can reveal problems even before failure in EQAS or even an adverse patient result Potential problems can be recognised by recognising patterns from graphs Review both the present cycle results as well as performance from previous cycle for the same analyte Graphs of Z score or SDI or VIS or % deviation for trends Otherwise trends will be missed
How to recognise problems ? Results may consistently be different from the target peer group mean - All results on one side of the mean (may be close to mean or at variable distances from mean) – Systematic Error Majority of results are close to the target value but some show larger deviation s on one side or both side of mean – RandomError Reasons and hence corrective action differs
How to recognise problems ? Random error is an error / mistake / inaccuracy that has no set pattern. Its occurrence cannot be predicted Results on an average are close to target mean. Few results show large deviations on either side of target Detected by sudden, undue % deviation /SDI /Z Score – > 3.5 Indicates lab’s imprecision / poor reproducibility Easily identified – values are far beyond the usual – e.g SDI from 1.5 to 4.0 – 6.0
How to recognise problems ? Systematic error – set pattern of error / mistake. Its occurrence can be explained and corrected Constant difference between the participant lab’s value and group mean All results lie on one side of mean Indicates lab’s bias or inaccuracy but good precision A progressive increase in deviation on the same side – ‘ shift’ or stabilizes after a gradual increase ‘trends in
Sources of Random Errors Random errors are blunders Transcription errors – result not correctly transcribed from the instrument to workbook or PT sheet or from the Workbook to the system Misplaced decimal points e.g serum potassium 58.2 instead of 5.82 Result was entered in the wrong instrument or method group on the result form of PT provider. Lab might have changed the method or instrument recently but not updated with PT provider
Sources of Random Errors Mislabeling errors, interchanging results of PT specimens, misplacing specimens in analyser rack, inappropriate reagents and standards Result of some other analyte entered in the PT form of the provider in the system Wrong units. Result in one unit in the instrument but not converted to unit of EQAS provider e.g ug /mL instead of ng/L , mg/dL instead of g/L Result found on evaluation report from PT provider not matching with the result on the report form mistake of PT provider Calculation errors (conversion from one unit to another)
Sources of Systematic Errors Recalibration if not done earlier – esp if a new lot of reagent has been used or if the open vial stability of the reagent is doubtful Instrument maintenance – major part needs servicing or replacement (optics, alignment, incubation temperature failure, Internal QC values having a bias Recent instrument malfunction, instrument failure soon after PT specimen testing Assay settings (sample volume, reagent volume, delay time incubation time no of readings to be taken etc. ) improper reconstitution of QC materials, water quality, not following manufacturer’s / PT provider’s instructions while reconstituting, storing or handling reagents / QC materials