Download
1 / 12
120 likes | 127 Views
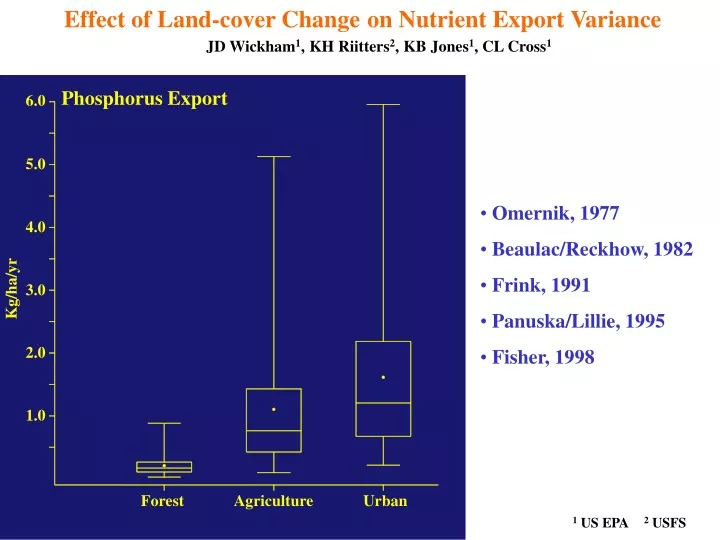
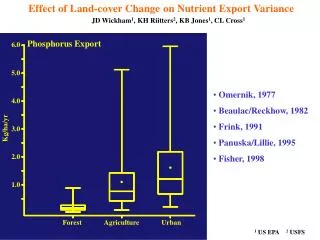
Effect of Land-cover Change on Nutrient Export Variance. JD Wickham 1 , KH Riitters 2 , KB Jones 1 , CL Cross 1. Phosphorus Export. 6.0. 5.0. Omernik, 1977 Beaulac/Reckhow, 1982 Frink, 1991 Panuska/Lillie, 1995 Fisher, 1998. 4.0. Kg/ha/yr. 3.0. 2.0. 1.0. Forest. Agriculture.

E N D
Effect of Land-cover Changeon Nutrient Export Variance JD Wickham1, KH Riitters2, KB Jones1, CL Cross1 Phosphorus Export 6.0 5.0 • Omernik, 1977 • Beaulac/Reckhow, 1982 • Frink, 1991 • Panuska/Lillie, 1995 • Fisher, 1998 4.0 Kg/ha/yr 3.0 2.0 1.0 Forest Agriculture Urban 1 US EPA 2 USFS
Impacts of Excessive Nutrients on Water Bodies • Aquatic Life Support • Low DO • Reduced light penetration • Nuisance/toxic algae blooms • Drinking Water • Taste and order issues • Clogging water intake systems • nuisance algae • Health issues (high nitrites) • Recreation • Reduced water clarity • Negative effect on real estate values • (U. of Maine, 1996) Cladophora glomerata
-- Methods -- Estimating the effect of land-cover change on N & P export variance • Compile proportions of forest, agriculture, and urban by 14-digit watersheds for eastern two-thirds of Maryland using 1992 and 2001 land-cover data (NLCD). • Run N and P export simulations models (by watershed) on 1992 and 2001 land-cover data (estimate mean & variance [1000 obs/ws/date]). • Repeat simulations 150 times (per watershed, per date) to generate confidence intervals for means and variances). • Compare confidence intervals – significance declared when there was a positive difference (a gap) between mean and variance ranges over time. 1992 2001 Ws 1 Ws 2
1.0 0.9 0.8 0.7 0.6 0.5 0.4 0.3 0.2 0.1 0.1 0.2 0.3 0.4 0.5 0.6 0.7 0.8 0.9 1.0 1992 Proportion Forest Changes in Nitrogen Export Distribution by Watershed • 143 of 812 watersheds had significant increases in export mean & variance. • Average percentage forest loss was 11% for watersheds with significant increase in variance. • Percentage forest loss was not constant: amount of forest loss required to significantly change variance increased as percentage forest decreased. 2001 Proportion Forest
1.0 0.9 0.8 0.7 0.6 0.5 0.4 0.3 0.2 0.1 0.1 0.2 0.3 0.4 0.5 0.6 0.7 0.8 0.9 1.0 1992 Proportion Forest Changes in Phosphorus Export Distribution by Watershed • 140 of 812 watersheds had significant increases in export variance. • Average percentage forest loss was 12% for watersheds with significant increase in variance. • Percentage forest loss was not constant: amount of forest loss required to significantly change variance increased as percentage forest decreased. 2001 Proportion Forest
Why Is Variance Important? Upper Choptank, MD 49% agriculture 49% forest 1% urban Fisher et al. 1998. ; Linker et al. 1996 USGS gauging station 01491000 An increase in variance is an increase in sensitivity to outside factors; outside factors are more difficult to control, making environmental management more difficult.
Restoration? Source: US EPA 1999. Protocol for developing Nutrient TMDLs. EPA 841-B-99-007
Riparian Buffers? • Ability of riparian vegetation to remove nutrients depends on the relative depths of rooting zone and shallow groundwater (Lowrance et al. 1997. Env. Mgt.) • Riparian buffers can be sources (instead of sinks) of P on a seasonal basis (Osborne and Kovacic, Fr. Bio. 1993). • Riparian buffers are not as effective in agricultural areas with tile drainage (Osborne and Kovacic, Fr. Bio. 1993). • Riparian buffers are less effective at removing P (than N) (Lowrance et al. Env. Mgt., 1997). • Entire watershed gives better R2 than near stream (Hunsaker/Levine, Bioscience, 1995). • Entire watershed (Omernik, 1981) Min Max N 2.89 11.50 P 0.15 0.65 Four-fold change in annual N/P export despite well-developed riparian network
Site Plan Review? High Impact Development Low Impact Development Runoff flow Residential bioretention system -- focused retention and infiltration
Growth Management? TN (kg/ha/yr) Construction-I 8.3 Construction-II 36.3 Line et al. 2003, Water. Env. Res.
A Future Conclusion … 5053 miles of Maryland streams/shorlines are identified as impaired due to nutrients (…epa.gov/owow/tmdl/303dcaus.html). In the face of land-cover change, what is your guess for the number miles of nutrient-related impairments in 2020? A Present Conclusion … The future is upon us … what should the plan be? Urban Urban Forest Forest Agriculture Agriculture 1992 2001


![[6.0 ] Fractions](https://cdn3.slideserve.com/6869547/6-0-fractions-dt.jpg)