Download
1 / 16
160 likes | 382 Views
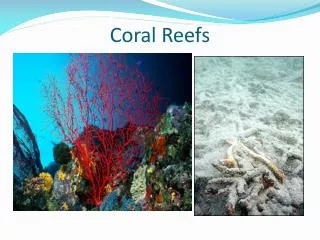
Worldview-02 offers new capabilities for the monitoring of threatened coral reefs. Jeremy M. Kerr National Coral Reef Institute Nova Southeastern University Khaled bin Sultan Living Oceans Foundation. Mapping coral reefs ecosystems. Coral reefs: Economically and socially important

E N D
Worldview-02 offers new capabilities for the monitoring of threatened coral reefs Jeremy M. Kerr National Coral Reef Institute Nova Southeastern University Khaled bin Sultan Living Oceans Foundation
Mapping coral reefs ecosystems • Coral reefs: • Economically and socially important • Declining health • Marine spatial planning- integrating spatial information into policy • Geospatial information • Benthic habitat maps • Bathymetric maps • Ecological and oceanographic models • Integrating remotely-sensed data: • Bridges gap between regional- and field-scale observations • Constrained by spectral and spatial resolution of the data • Worldview-02 increases the available spatial and spectral • information Elkhorn coral (Acropora palmata) Boulder star coral (Montastraea spp.) QuickBird imagery (True color) Optically-derived bathymetry Benthic habitat map
Deriving depth from a multispectral image • Important optical properties of water • Beer’s law: light attenuates exponentially with depth • Light attenuation varies across the visible spectrum • Stumpf et al. (2003) estimated depth based on these two properties with the model: • Where • = estimated depth • = reflectance of band i • = constant set to ensure that the logarithm is positive • , = constants estimated by fitting a linear regression of the band-ratio to known depths • Observation: • Increasing the polynomial from first-order to second- or third-order can lead to better depth estimates. • Can the Stumpf model be improved?
Data • Worldview-02 (WV2) image • 10-km by 10-km (100 km2) area in the Florida Keys • Pixel resolution of 2-m by 2-m (4 m2) • Coincides with a pre-existing bathymetric map • Provided the spectral inputs for the expanded depth derivation model • Experimental Advanced Airborne Research LiDAR (EAARL) Digital Elevation Model (DEM) • Created through a combined effort by the USGS, NASA, and NPS (USGS 2008) • Depths values for approximately 129 km2 • Depth estimates have error of ±15 cm • Pixel resolution of 1-m by 1-m (1 m2) • Provided the ‘ground-truth’ data for fitting the models and assessing accuracy of predicted depths
Data Reef Vegetation Sand Boats Optically- deep water* • WorldView-2 image (True color): • Subset 1 (red box) was used for model comparison. • Subset 2 (orange box) and Transects A, B, C, and D (black lines) were used for accuracy assessments. • Each Subset included 4 million pixels • Transects included between 2000 and 3000 pixels • EAARL DEM: • Subsets and Transects are drawn for reference * - Optically-deep waters are those in which the sea-floor depth is greater than the detection limit (here: depths > 20 m, approximately).
Pre-processing • WV2 image: • Sea-surface state between the ‘traditional’ and ‘new’ bands varied • Physical sensor offset • Limited the possible band-ratios • Sun-glint removal (SGR) • Based on the model of Hedley et al. (2003) • Applied to irradiance values • Deep-water correction (DWC) • Applied to apparent reflectance values • EAARL DEM: • Resampled using nearest-neighbor kernal to match the spatial resolution of the Worldview-02 image Close-up from the a) coastal and b) blue bands demonstrating the observed difference in pixel values between the ‘traditional’ and ‘new’ bands. The top area in the yellow box (rows 1 and 2) is similar in both bands, but the bottom area (rows 3 to 7) has a different pattern in each band.
Expanding the Stumpf model • Can the Stumpf model be improved? • Hypothesis: Increasing the spectral information input into the Stumpf model will improve depth estimates. • Increasing the number of band-ratios input into the model results in an expanded model: • Where the n-th band-ratio, , is now: • The constant e is added to ensure that the value inside the logarithm is greater than 0. • What is the optimal set of band-ratios for depth-estimation?
The optimal combination of band-ratios • Band-ratios: • Model selection: Based on Akaike Information Criteria (AIC; Akaike 1973) • Sample size: 1 million pixels • Randomly selected from the 4 million pixels included in Subset 1 • Best-fit model: • Full model (containing all 6 band-ratios) • Same model selected for all 4 pre-processing levels • What is the optimal level of pre-processing? • Limited to the within the ‘traditional’ and ‘new’ sets due to the observed offset • 63 candidate models • 4 levels of pre-processing
The optimal level of pre-processing • Aggregated and compared all 252 models using AIC • Overall Best-fit model: • Full-model with both SGR and DWC • Other results: • Top 3 models were full models with differing levels of pre-processing. • 8 of the top 10 models had both SGR and DWC applied. • The top 10 models all contained 4 or more band-ratios. • How does sample size affect the model selection results? • The top 10 models based on AIC values. • AICc is the AIC value after correction for small samples sizes. • ΔAIC is the difference in AIC values between the model and the best-fit model. • AICw is the weight of evidence within the data-set supporting the model.
The effect of sample size on the model selection • Method: • Compared top 10 models • Sample sizes: 100, 1000, 10 000, and 100 000 • 100 re-samples from Subset 1 selected for each sample size • Results: • Rank 1 model pre-dominantly selected for • all 4 sample sizes • Rank 2 and 3 models occasionally selected • Rank 4 through 10 models rarely or never • selected • How well does this new model perform compared to Stumpf’s original model?
Data • Note: • Subset 1 (red box) was used for determining optimal model, optimal pre-processing level, • and the effects of sample-size. • Subset 2 (orange box) and Transects A through D (black lines) were used for the accuracy assessment.
Assessing the expanded model Reef top • Depth estimates from the full and blue/green models compared with depths form the EAARL DEM • Overall increase in precision of depth estimates • Blue/green model: • RMSE: 1.03 m • NRMSE: 7.32% • Full model: • RMSE: 0.77 m • NRMSE: 5.49% • Similar increase in precision along the 4 Transects • Increased precision over areas with high albedos Sand Reef top Depth values from the EAARL DEM (black), Full model (blue), and blue/green model (red) along Transects A through D. The full model better estimated depths over reef-top and sand areas.
Summary of results • Expanded model: • Altered an established model from a linear regression to a multiple linear • regression. • Allowed for increased spectral information to be used for depth estimation. • Full model (with 6 band-ratios) selected as the best-fit model. • Pre-processing: • Sun-glint removal and atmospheric correction improve depth estimates. • Sample size: • Full model feasible even when ground-truth data are limited. • Accuracy: • Full model had more precise depth estimates than the blue/green model. • It also had more precise estimates over seafloor features with high albedos.
Future application • Depth is a fundamental environmental parameter in marine systems. • Ecologically important • Resources and disturbances vary with depth. • Benthic community composition varies with depth. • Benthic habitat maps • Depth can improve classification accuracy • Support modelling and analyses • Species distribution models • Hydrodynamic models • Geologic history • Marxan analyses • Fine-scale, detailed bathymetric maps covering large spatial extents improve our knowledge of the distribution of marine resources and the environmental processes shaping these distributions.
Future application • Global Reef Expedition: Science Without Borders (www.globalreefexpedition.org) • In partnership, the Living Oceans Foundation and host countries will explore, map, and characterize coral reefs in remote locations enabling comparisons with coral reefs located near populated coastlines. • Research activities: • Acquire multispectral satellite imagery • Collect detailed ground-truth and • bathymetric data • Conduct surveys of benthic and fish • communities • Evaluate processes controlling reef • community structure • Targeted sampling and assessment of • resilience indicators • Evaluate connectivity within and • between reef ecosystems • Study sites in the Bahamas (right): • Cay Sal Bank (green box), • Great Inagua (blue box), • Little Inagua (orange box) • Hogsty Reef (red box)
Acknowledgements National Coral Reef Institute at Nova Southeastern University’s Oceanographic Center Dr. Sam Purkis Gwilym Rowlands Alexandra Dempsey Khaled bin Sultan Living Oceans Foundation Capt. Phillip Renaud Dr. Andrew Bruckner Judges for DigitalGlobe’s “8-band Research Challenge” Dr. Ing. Anko Börner Dr. Stuart R. Phinn Dr. Hrishikesh Samant Dr. Walter Scott DigitalGlobe Ian Gilbert Brett Thomassie Jeremy M. Kerr National Coral Reef Institute Nova Southeastern University Khaled bin Sultan Living Oceans Foundation jk908@nova.edu