Download
1 / 17
170 likes | 291 Views
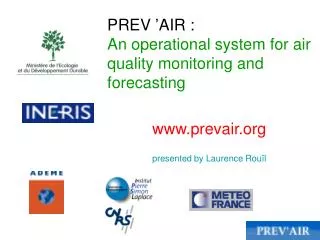
THE AUSTRALIAN AIR QUALITY FORECASTING SYSTEM - Lessons Learned and Looking Forward. www.cawcr.gov.au. Martin Cope, Sunhee Lee, Alan Wain and Dale Hess November 2011. Sydney: Days per year 1-h O 3 > 0.1 ppm. (DECC- Trends in air quality in New South Wales 1994-2006).

E N D
THE AUSTRALIAN AIR QUALITY FORECASTING SYSTEM - Lessons Learned and Looking Forward www.cawcr.gov.au Martin Cope, Sunhee Lee, Alan Wain and Dale Hess November 2011
Sydney: Days per year 1-h O3 > 0.1 ppm (DECC- Trends in air quality in New South Wales 1994-2006) Air Quality- Australian Coastal Airsheds Ozone Particles The Centre for Australian Weather and Climate ResearchA partnership between CSIRO and the Bureau of Meteorology
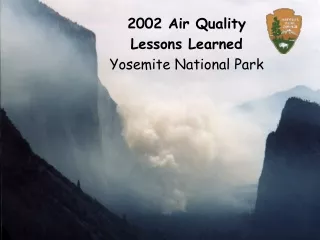
Air Quality- Rural Cities A fire impacted rural site- Ovens Valley Daily PM2.5 levels Hourly O3 levels Prescribed burning AAQS exceeded on 7 days Wildfires 2006/2007 AAQS exceeded on 13 days The Centre for Australian Weather and Climate ResearchA partnership between CSIRO and the Bureau of Meteorology
Air Quality Forecasting Systems in Australia AQ forecasts typically for 24 to 48 h AAQFS forecast domains Dust, smoke, O3, NO2, PM10,PM2.5, AQI Expert System Ozone, visibility (EPA->Bureau) Expert System ozone, visibility (EPA) CFS- smoke (EPA) Statistical PM10 (Bureau) Haze-bot Winter wood smoke Low visibility (EPA -> Bureau) Expert System Ozone, visibility Heuristic + Bureau Smoke (EPA) The Centre for Australian Weather and Climate ResearchA partnership between CSIRO and the Bureau of Meteorology
Regional and urban grids Adelaide Australian Air Quality Forecasting System (Set up for the Sydney 2000 Olympics) Regional and urban grids -NWP meso_LAPS (0.05°) -CTM (0.05 and 0.01°); -gas-phase primary and photochemical smog species; - aerosol species include dust, sea salt, primary aerosols (domestic wood combustion, motor vehicle) + secondary (simple) inorganic. -24-36 hour forecasts issued twice per day Australian grid -meso_LAPS (0.125°) -CTM (0.20°); offline; dust and smoke 36-h forecast issued daily http://www.dar.csiro.au/information/aaqfs.html
Emissions Processing System + Data Numerical Weather Prediction System Chemical Transport Model 3-dimensional air pollution concentration forecasts Verification System + AQ data Web + Graphical Display Systems Australian Air Quality Forecasting System NMOC Bureau of Meteorology CSIRO Provided by the State Environment Departments Provided to the State Environment Departments 00 UTC and 12 UTC forecasts The Centre for Australian Weather and Climate ResearchA partnership between CSIRO and the Bureau of Meteorology
AAQFS processes • Offline chemical transport. Clean- or warm-start initial conditions for the CTM • Anthropogenic emissions varied by month, day and hour. Motor vehicle and domestic wood smoke emissions varied by forecast temperature. • Natural emissions (dust, biogenic VOC, natural NOx and sea salt) are calculated in-line. • Photochemical smog is modelled with Carbon Bond or Generic Reaction Set. • Single moment, multi-section, multi-component aerosol scheme. The Centre for Australian Weather and Climate ResearchA partnership between CSIRO and the Bureau of Meteorology
Ozone forecasting POD The Centre for Australian Weather and Climate ResearchA partnership between CSIRO and the Bureau of Meteorology
Dust Forecasting PM10 (mg/m3) Emissions (kg/s) Lu, H. and Y. Shao dust scheme The Centre for Australian Weather and Climate ResearchA partnership between CSIRO and the Bureau of Meteorology
Dust Forecasting Verification through analysis of extreme events 10:00 EST October 23rd 2002 http://rapidfire.sci.gsfc.nasa.gov/ Wain et al. http://www.dar.csiro.au/pollution/docs/AWain_files/frame.htm
Location of Sentinel hotspots 11-12 Jan 2005 Smoke plume impacts Adelaide as observed Smoke Plume Envelope Forecasting • Retrieve automated hotspot locations via satellite images • Process the data to determine fire locations • Initiate qualitative emissions at source locations and compute transport and dispersion as a passive scalar The Centre for Australian Weather and Climate ResearchA partnership between CSIRO and the Bureau of Meteorology http://sentinel2.ga.gov.au/acres/sentinel/index.shtml
AAQFS- lessons learned SCIENCE • Ozone (non-fire), large dust storms and fires are forecast reasonably well. • Urban particles are not well predicted. • 0.05º NWP meteorology is above urban scale; and the nocturnal pbl is poorly represented. • Air emissions inventories for particles were problematic (but have since improved). • Smoke is modelled as a tracer, hence no coupling between smoke and ozone/secondary particles. • Dust forecasting relies on some climatological data (not good for droughts) The Centre for Australian Weather and Climate ResearchA partnership between CSIRO and the Bureau of Meteorology
AAQFS- lessons learned LOGISTICAL • Inventories are not readily updated by the EPAs • Little on-going support in-house to maintain the system and address science and logistical problems • Little on-going support to promote AQ forecasting to external stakeholders The Centre for Australian Weather and Climate ResearchA partnership between CSIRO and the Bureau of Meteorology
LOOKING FORWARD Melbourne, Victoria, population 4 million. - projected to increase by 20% in 2030 Emission Changes 2030-2006 (%) Population Exposure Change 2070-2006 (%) The Centre for Australian Weather and Climate ResearchA partnership between CSIRO and the Bureau of Meteorology
Forecast peak 24-h PM10 2004-2008 Wind blown dust The frequency of drought is projected to increase by up to 20% by 2020 over most of Australia. By 2070, drought frequency increases of 20-80% in the south, 20-40% in Qld and 0-20% elsewhere (except central WA) are projected. “Desert Dust. An Unrecognized Source of Dangerous Air Pollution?” Thomas Sandstrom and Bertil Forsberg (Epidemiology 2008;19: 808–809) The Centre for Australian Weather and Climate ResearchA partnership between CSIRO and the Bureau of Meteorology
Australian AQ forecasting- looking forward • Focus on improving our forecasting capability for dust and smoke • Large scale impacts, likely to increase under a warming trend; • Significant local-regional scale impacts of extended planned burning season • Particles and photochemical smog • No coherent forecasting methodology currently used in Australia; • Multiple stakeholders, federal to local government + industry (DEWHA; jurisdictions, landuse managers, energy (e.g. solar), agriculture (e.g. grape growing), aviation. • Volcanic ash forecasting for aviation The Centre for Australian Weather and Climate ResearchA partnership between CSIRO and the Bureau of Meteorology
Thank you The Centre for Australian Weather and Climate Research A partnership between CSIRO and the Bureau of Meteorology Martin Cope Principal Research Scientist Phone: 03 9239 4647 Email: martin.cope@csiro.au Web: www.cawcr.gov.au www.cawcr.gov.au