Download
1 / 18
180 likes | 295 Views
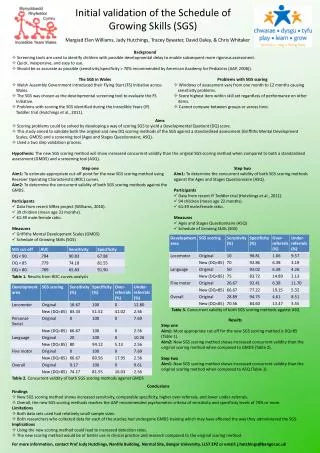
Validation of N1 Light Curves of the Initial Run (AN1_STAR product, IRa01) F. Baudin, E. Michel. Specifications (COR-SP-0-83-PROJ ). Duty cycle: 90% during 5 days, 80% on a run Noise level: 0.6 ppm between 0.1 and 10 mHz in 5 days for a (mV=5.7) star and photon-noise limited up to mV=9.

E N D
Validation of N1 Light Curves of the Initial Run (AN1_STAR product, IRa01) F. Baudin, E. Michel
Specifications (COR-SP-0-83-PROJ ) • Duty cycle: 90% during 5 days, 80% on a run • Noise level: 0.6 ppm between 0.1 and 10 mHz in 5 days for a (mV=5.7) star and photon-noise limited up to mV=9. • Polluted frequency range (orbital perturbations): <10% between 0.1 and 1 mHz
IRa01 • duration: ≈60 days, • from end of January to Beginning of April • 10 stars observed
Duty cycle Gaps (sec) Without recovering SAA events (fine filtering, imagette photometry)
Noise level Noise level / photon noise level Measured at: 0.1mHz (over 20 mHz) 6 mHz (over 1mHz)
Orbital peaks Method: if P(forbit) > 2P(local background) then 5 bins x 3 declared polluted.
Orbital peaks Mv = 9.5 !!!
N1 data / Specifications Conclusions (1) • Duty cycle: 90% during 5 days, 80% on a run • OK DC≈89.5% (but SAA gaps dominant problem, improvement at N2?) • Noise level • - photon-noise limited between 0.1 and 10mHz up to mV=9: • OK at high freq (6mHz): <N>/<Nphot> ≈1.5 up to mV=9 • at 100mHz: dominated by stellar signal in most cases, down to <N>/<Nphot> ~ 2-10 several times • - N = 0.6 ppm in 5 days for a (mV=5.7) star: • OK N = 0.55+-0.1 on mV=5.7 (ID20), according to measurement at 6mHz
N1 data / Specifications Conclusions (2) • Polluted frequency range(orbital perturbations): • <10% between 0.1 and 1 mHz: • OK< 1% on [0.1, 1mHz] • OK%on [0.1,10mHz] • Remark: sometimes, observed harmonics of the orbital until 10 mHz (n=60!!!)