Download
1 / 9
90 likes | 176 Views
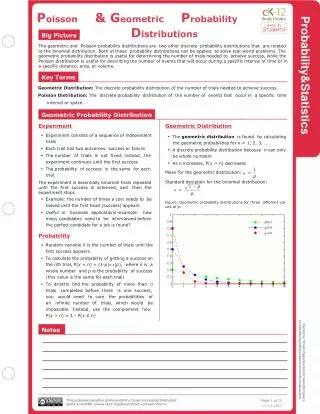
Geometric Distribution. The geometric distribution computes the probability that the first success of a Bernoulli trial comes on the xth trial. For example, suppose we want to roll a four on a six-sided die. We will roll until we get a four, then we stop.

E N D
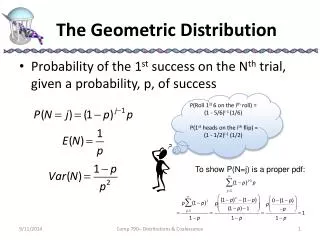
The geometric distribution computes the probability that the first success of a Bernoulli trial comes on the xth trial. For example, suppose we want to roll a four on a six-sided die. We will roll until we get a four, then we stop. The random variable is the number of rolls until we get a four. The probability of getting a four on the first roll is P(1)=1/6. The probability of getting a four for the first time on the second roll is P(2)=(5/6)(1/6)=5/36.
The probability of getting the first four on the third roll is P(3)=(5/6)(5/6)(1/6)=25/216. In general, we see that all but the last roll are not fours and so have a probability of 5/6 and the last roll will have a probability of 1/6. So, P(X)=(5/6)(X-1)(1/6) Generalizing to other problems, it is not so difficult to see that as there are X-1 failures followed by one success.
We can work many problems on the TI-83, although the formula is so simple that you may just want to work them directly. Problem: Compute the probability that the first four occurs on the third roll of the die. On the calculator, press <2nd> <DISTR> <D:geometpdf(> then type in 1/6,3). (You can convert to a fraction if you like with <MATH> <1:Frac> <ENTER>.) As you see, we get the same answer as we got earlier.
We can use a sequence to get several probabilities at once. Problem: Compute the probabilities that the first four occurs on the first through fifth rolls of a fair die. This example will be worked on the homescreen so that we can see fractions. Most often I work in lists, as we did with the binomial distribution. Press: <2nd> <DISTR> <D:geometpdf(> then type 1/6,{1,2,3,4,5}) <ENTER>. Hint: The { symbol uses the 2nd function, then the ( key. Now press: <MATH> <1:Frac> <ENTER> Use the toggle arrows to scroll to see the other answers. {1/6, 5/6, 25/216, 125/1296, 625/7776}
Problem: Find the probability of getting a four in the first three trials, i.e., P(X3). In this case we use the cumulative density function geometcdf. On the TI-83, press: <2nd> <DISTR> <E:geometcdf(> then type 1/6,3) As you see, we find the probability is 91/216. We can also make relative frequency histograms for the pdf and the cdf.
Problem: Construct relative frequency histograms for the first four on rolls of a six-sided die. Show X=1 through X=7. Enter 1 through 7 in L1. Let L2 = geometpdf(1/6,L1). Set a window as shown, and set up the STAT PLOT. Trace to see the area of each column in the histogram.
Last Problem: Plot the histogram for the cumulative density function for the same experiment. Show X=1 through X=7. Enter 1 through 7 in L1. Let L2 = geometcdf(1/6,L1). Set a window as shown, and set up the STAT PLOT. Trace to see the area of each column in the histogram.