Download
1 / 1
10 likes | 93 Views
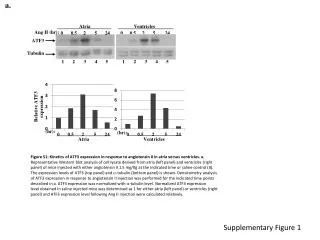
2.5. 8.0. PCBs. 7.0. p.p ’ -DDE. 2.0. 6.0. 1.5. 5.0. 4.0. 1.0. 3.0. 2.0. 0.5. 1.0. 0. 0. 1.2. 0.6. Trans-nonachlor. 1.0. Q1. 0.5. 0.8. 0.4. 0.6. 0.3. 0.4. 0.2. ( g/g lipid). 0.2. 0.1. 0. 0. 0.12. 0.06. 0.10. HCB. TBA. 0.05. 0.08. 0.04. 0.06. 0.03. 0.04.

E N D
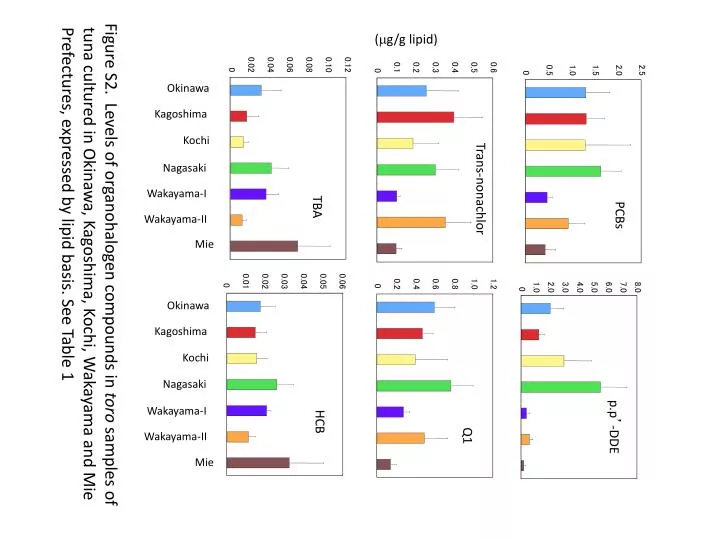
2.5 8.0 PCBs 7.0 p.p’-DDE 2.0 6.0 1.5 5.0 4.0 1.0 3.0 2.0 0.5 1.0 0 0 1.2 0.6 Trans-nonachlor 1.0 Q1 0.5 0.8 0.4 0.6 0.3 0.4 0.2 (g/g lipid) 0.2 0.1 0 0 0.12 0.06 0.10 HCB TBA 0.05 0.08 0.04 0.06 0.03 0.04 0.02 0.02 0.01 0 0 Mie Mie Kochi Kochi Okinawa Okinawa Nagasaki Nagasaki Kagoshima Kagoshima Wakayama-I Wakayama-I Wakayama-II Wakayama-II Figure S2. Levels of organohalogen compounds in toro samples of tuna cultured in Okinawa, Kagoshima, Kochi, Wakayama and Mie Prefectures, expressed by lipid basis. See Table 1