Download
1 / 1
10 likes | 125 Views
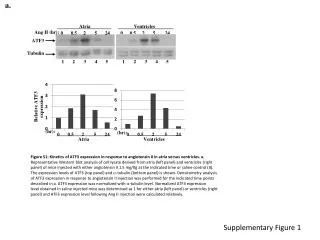
Supplemental Figure 3. Ngn3. HES1. Hexokinase 2. 4. 2.5. 8. 2. 3. 6. 1.5. 4. 2. 1. 2. 1. 0.5. 0. 0. 0. Ngn3-EGFP +. Ngn3-EGFP -. Ngn3-EGFP +. Ngn3-EGFP -. Ngn3-EGFP +. Ngn3-EGFP -. Insulin I. Pdx-1. MafA. 15. 2. 3. 1.5. 10. 2. 1. 5. 1. 0.5. 0. 0. 0.

E N D
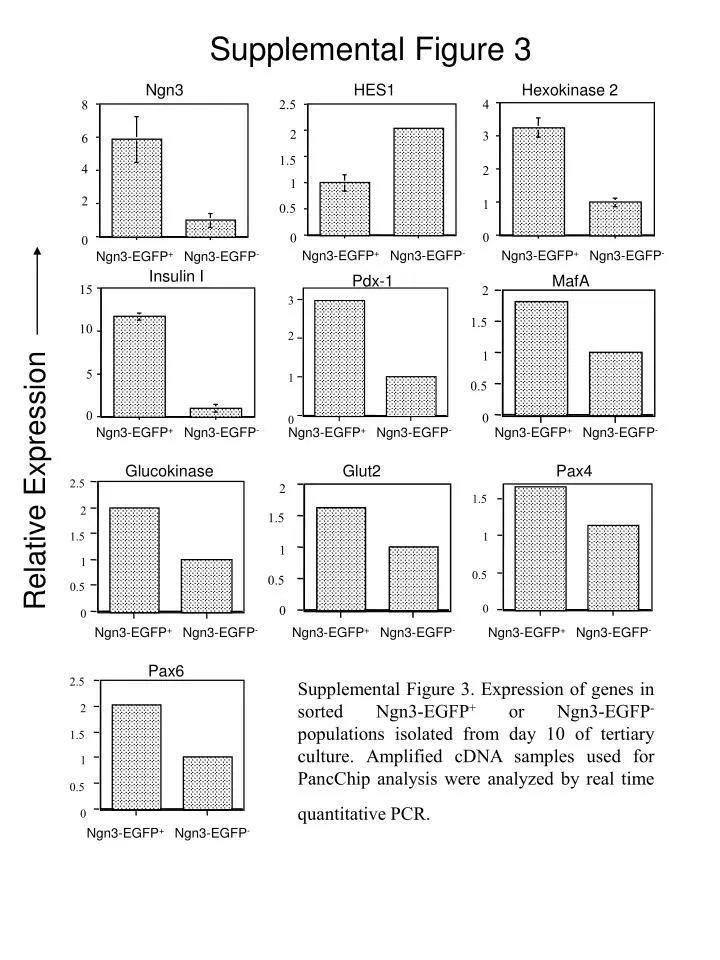
Supplemental Figure 3 Ngn3 HES1 Hexokinase 2 4 2.5 8 2 3 6 1.5 4 2 1 2 1 0.5 0 0 0 Ngn3-EGFP+ Ngn3-EGFP- Ngn3-EGFP+ Ngn3-EGFP- Ngn3-EGFP+ Ngn3-EGFP- Insulin I Pdx-1 MafA 15 2 3 1.5 10 2 1 5 1 0.5 0 0 0 Ngn3-EGFP+ Ngn3-EGFP- Ngn3-EGFP+ Ngn3-EGFP- Ngn3-EGFP+ Ngn3-EGFP- Glucokinase Glut2 Pax4 Relative Expression 2.5 2 1.5 2 1.5 1.5 1 1 1 0.5 0.5 0.5 0 0 0 Ngn3-EGFP+ Ngn3-EGFP- Ngn3-EGFP+ Ngn3-EGFP- Ngn3-EGFP+ Ngn3-EGFP- Pax6 Supplemental Figure 3. Expression of genes in sorted Ngn3-EGFP+ or Ngn3-EGFP- populations isolated from day 10 of tertiary culture. Amplified cDNA samples used for PancChip analysis were analyzed by real time quantitative PCR. 2.5 2 1.5 1 0.5 0 Ngn3-EGFP+ Ngn3-EGFP-