Download
1 / 26
270 likes | 382 Views
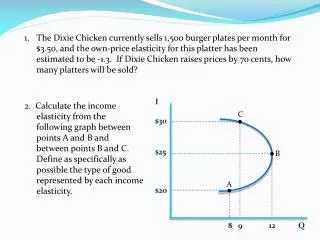
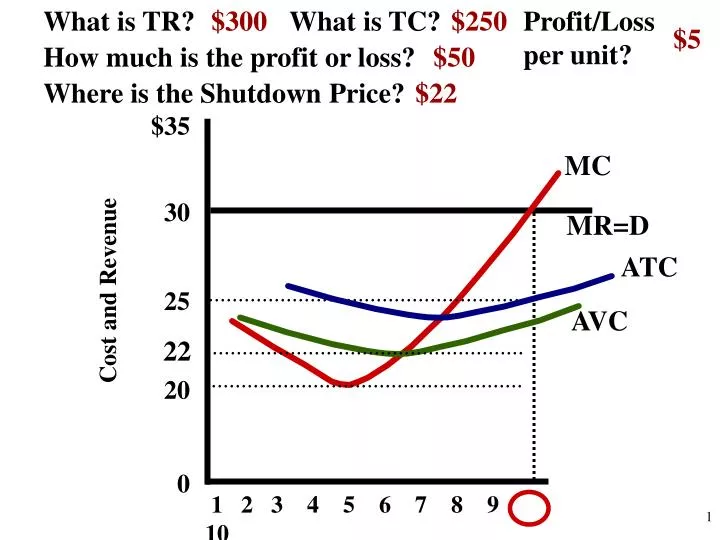
What is TR?. $300. What is TC?. $250. Profit/Loss per unit?. $5. How much is the profit or loss?. $50. Where is the Shutdown Price?. $22. $35 30 25 20 0. MC. MR=D. ATC. Cost and Revenue. AVC. 22. 1 2 3 4 5 6 7 8 9 10 . 1.

E N D
What is TR? $300 What is TC? $250 Profit/Loss per unit? $5 How much is the profit or loss? $50 Where is the Shutdown Price? $22 $35 30 25 20 0 MC MR=D ATC Cost and Revenue AVC 22 1 2 3 4 5 6 7 8 9 10 1
Unit 3: The Costs of Production and Perfect CompetitionREVIEW ACTIVITY 2
Memorizing vs. Learning 123571113171923
Review Circles Odd numbers Even Numbers
3. The Law of Diminishing Marginal Returns and the causes of the 3 Stages
5. Examples of Fixed and Variable Costs and the difference between short-run and long-run. 11
8. Shifting Costs Curves (Changing Variable and Fixed Costs) 14
9. Why is MC “U” Shaped? (Nike swoosh) 15
10. Explain Long-Run and Economies and Diseconomies of Scale 16
11. Graphing Long-Run Average Cost Curves (Economies and Diseconomies of Scale) 17
12. Characteristics of Perfect Competition with examples of each 18
13. Explain Industry, Firm, Price Taker, TR, MR, Economic Profit/Loss, and Profit Max./Loss Min. Rule 19
14. Calculating TR, TC, and profit/loss from a firm graph 20
15. Explain/draw shut down point and how MC above AVC is the short-run supply curve 21
18. Draw firm and industry going from short-run profits to long-run equilibrium 24
19. Draw firm and industry going from short-run losses to long-run equilibrium 25
21. Draw a firm making a $40 profit selling 20 units at a price of $14.
22. Draw a firm making a $60 loss selling 10 units at a price of $35.