Download
1 / 33
340 likes | 553 Views
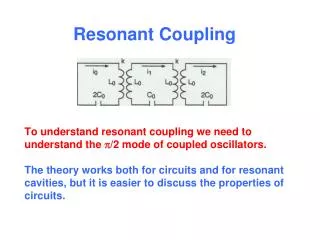
NOISE IN RESONANT BARS. Massimo Visco for ROG Collaboration CNR - Istituto di Fisica dello Spazio Interplanetario - Roma INFN – Sezione di Roma2. NOISE IN RESONANT DETECTORS. Matched Filtering. Thermal noise. Seismic noise. Low and ultralow temperature. Mechanical filters. Mechanical

E N D
NOISE IN RESONANT BARS Massimo Visco for ROG Collaboration CNR - Istituto di Fisica dello Spazio Interplanetario- Roma INFN – Sezione di Roma2
NOISE IN RESONANT DETECTORS Matched Filtering Thermal noise Seismic noise Low and ultralow temperature Mechanical filters Mechanical vibration Electrical signal GW TRANSDUCER AMPLIFIER DATA dL Cosmic ray noise Electronic noise Veto Low noise amplifier (SQUID)
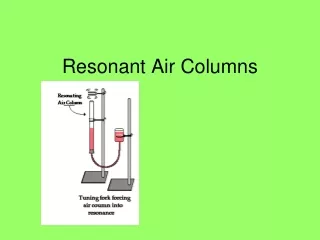
CROSSSECTION ·The cross section is sharply peaked at the resonant frequency /0 Sound speed Resonance curve Antenna mass Direction Polarization ·The mass must be as large as possible ·The sound speed must be as large as possible (i.e. once the frequency is fixed the detector linear dimensions must be the largest possible) ·The sensitivity depends on the orientation between the wave and the axis of the bar
First stage Second stage
Vertical direction • Horizontal direction
AURIGA SUSPENSIONS LHe4 vessel Al2081 holder Electronics wiring support Main Attenuator Thermal Shield Compression Spring Transducer
Columns modes up 180 Hz Holder modes Titanium springs 1E-9 No lines 690-1250 Hz 1E-10 1E-11 displacement (m) 1E-12 1E-13 1E-14 1E-15 500 1000 1500 2000 m/Hz1/2 frequency (Hz) Accelerometerover the holder at 600 Hz attenuation > 140dB (theoretical 186 dB) C shaped springs modes Accelerometer bottom of the column Electronic noise of the accelerometer m/Hz1/2
CRIOSTATO DI NAUTILUS Cosmic ray detector Cosmicray detector SQUID electronics Cylindricalbar Rotating platform Dilution refrigerator SQUID amplifier Cryostat Transducer
DILUTION REFRIGERATOR • NAUTILUS and AURIGA bars are the largest mass ever cooled below 1K (145 mK)
3He out 3He 3He-4He Dilution Refrigerator The liquid (the concentrated 3He phase) is lighter and floats on a 4He sea, in equilibrium with the 6.5% “vapor”. When 3He passes from the low entropy liquid to the vapor phase (high entropy) it expands and absorbs heat. 4He Mixing chamber
EFFECT OF COSMIC RAYS ON A RESONANT DETECTOR o zo lo 2 R L Grüneisen coefficient Energy lost Calculation for Nautilus sound velocity density The longitudinal mode of vibration of the antenna is excited by the thermal expansion due to the energy lost by the particles
11.5 mK • The first analysis confirmed the calculation made by several authors. P.Astone et al.: “Cosmic rays observed by the Resonant Gravitational wave detector Nautilus" Physical Review Letter, 84, (2000)14-17 Average 58 K 87 TeV (K) (x 5000) • Detection of very large unexpected events. threshold P.Astone et al.: ”Energetic Cosmic Rays observed by the resonant gravitational wave detector NAUTILUS" , Phys. Letters B 499, Feb 2001 16-22 time (s)
T<1K Event rate (day-1)
COSMIC RAY INTERACTION WITH NAUTILUS 72 streamer chambers (6x6)m Antenna 30 streamer chambers (2.5x6)m
Thermal noise SF = MkTwr/Q Electronic noise Vn; In Tn=√Vn2In2 /k The mechanical oscillator Mass M Speed of sound vs Temperature T Quality factor Q Res. frequency fr The amplifier Noise temperature Tn The transducer Efficiency
NEW AMPLIFIER • For the read-out of resonant detectors SQUID amplifiers were widely used, to avoid the second stage noise a double squid amplifier is required
Trento (2 stage) • An alternative possible read-out is one based on a Back Action Evading scheme
HOW THE DIFFERENT SOURCES OF NOISE CONTRIBUTE TO THE OVERALL SENSIVITY? • There are two intrinsic sources of noise that cannot be avoided • Thermal noise • Electronic noise
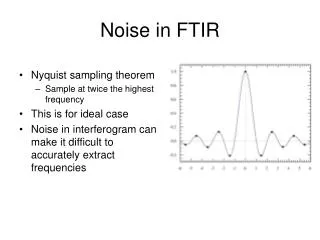
The signal and the narrow-band noise have similar shape. If we consider only narrow band- noise the bandwidth is infinite . NOISE CONTRIBUTION IN BAR DETECTORS SNR Narrow-band Noise Signal
·When the wide-band noise is not negligible the bandwidth of the detector depends on the ratio between wide and narrow band noise (): SNR Signal wide-band Noise Narrow-band Noise
SENSITIVITY OF BAR DETECTORS • The sensitivity of a detector is usually given in terms of the noise spectral density referred to the input of the antenna Sh (1/Hz) • The “peak” sensitivity depends on “physical” parameters (T,M,Q). To increase the overall sensitivity a larger bandwidth f is required. It can be obtained decreasing the electronics noise contribution and increasing the energy transfer.
To improve the sensitivity peak sensitivity (monochromatic, pulse and stochastic background) we need: • Large mass • Reduce the thermodynamic temperature • Increase the quality factor New detector Spheres New materials To improve the bandwidth (monochromatic, pulse and stochastic background) we need: Development of the transducers and electronics read out • Increase the coupling • Reduce the electronic noise
WIDENING THE BAND IN EXPLORER < 10-20 Hz-1/2 on 7 Hz Old readout 1998 < 10-20 Hz-1/2 on 50 Hz 2001 New readout 2003 Increasing the Bandwidth of Resonant Gravitational Antennas: The Case of ExplorerPRL 91, 11 (2003)
DATA TAKING DURING 2004 NAUTILUS EXPLORER 3.5 ·10-19 2·10-19
GAUSSIANITY NAUTILUS EXPLORER 12 hours of data on Sept 4th, 2004
GAUSSIANITY NAUTILUS EXPLORER 1 day of data on July 2004