Download
1 / 75
770 likes | 923 Views
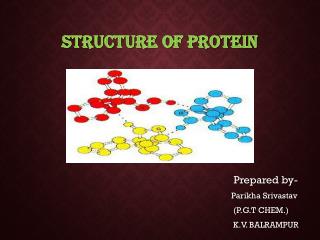
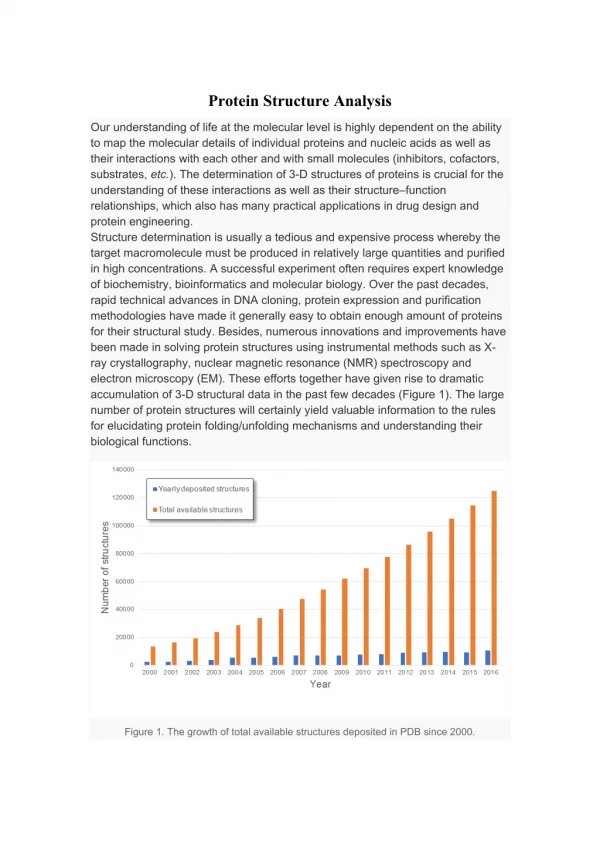
Structural Analysis of Protein Structure. Circular Dicroism Fluorescence X-ray NMR. Methods for Secondary Structural Analysis.

E N D
Structural Analysis of Protein Structure Circular Dicroism Fluorescence X-ray NMR
Methods for Secondary Structural Analysis • A number of experimental techniques can selectively examine certain general aspects of macromolecular structure with relatively little investment of time and sample. • Reasonable estimates of protein secondary structure content can be determined empirically through the use of Circular dichroism (CD) spectroscopy Nuclear Magnetic Resonance (NMR) spectroscopy FT-infrared spectroscopy
Circular Dichroism • Circular dichroism (CD) spectroscopy is a form of light absorption spectroscopy that measures the difference in absorbance of right- and left-circularly polarized light (rather than the commonly used absorbance of isotropic light) by a substance. • It is measured with a CD spectropolarimeter. The instrument needs to be able to measure accurately in the far UV at wavelengths down to 190 - 170 nm (170 - 260 nm). • The difference in left and right handed absorbance A(l)- A(r) is very small (usually in the range of 0.0001) corresponding to an ellipticity of a few 1/100th of a degree.
Physics of CD • Linear polarized light can be viewed as a superposition of opposite circularly polarized light of equal amplitude and phase. • A projection of the combined amplitudes perpendicular to the propagation direction thus yields a line. • When this light passes through an optically active sample with a different absorbance A for the two components, the amplitude of the stronger absorbed component will be smaller than that of the less absorbed component. The consequence is that a projection of the resulting amplitude yields an ellipse instead of the usual line, while the polarization direction has not changed. The occurrence of ellipticity is called Circular Dichroism.
Rotation of Plane-polarized Light by an Optically Active Sample • Pockels cell produces a beam that is alternately switched between L and R. The beam then passes through the sample to a photomultiplier. The detected signal can then be processed as ΔA vs λ.
Physical Principles of CD • Inherently asymmetric chromophores (uncommon) or symmetric chromophores in asymmetric environments will interact differently with right- and left-circularly polarized light resulting in circular dichroism. • Right- and left-circularly polarized light will be absorbed to different extents at some wavelengths due to differences in extinction coefficients for the two polarized rays called circular dichroism (CD). • Circular dichroism can only occur within a normal absorption band and thus requires either an inherently asymmetric chromophore (uncommon) or a symmetric one in an asymmetric environment.
Instrumentation • The most common instruments around are the currently produced JASCO, JobinYvon, OLIS, and AVIV models. • We have the Jasco 710 and 810 models with temperature controllers. The air cooled 150W Xenon lamp does not necessitate water cooling. • You still need to purge with ample nitrogen to get to lower wavelengths (below 190 nm).
Typical Initial Concentrations • Protein Concentration: 0.5 mg/ml (The protein concentration needs to be adjusted to produce the best data). • Cell Path Length: 0.5-1.0 mm. If absorption poses a problem, cells with shorter path (0.1 mm) and a correspondingly increased protein concentration and longer scan time can be employed. • Stabilizers (Metal ions, etc.): minimum • Buffer Concentration: 5 mM or as low as possible, while maintaining protein stability. A typical buffer used in CD experiments is 10 mM phosphate, although low concentrations of Tris, perchlorate or borate is also acceptable. • As a general rule of thumb, one requires that the total absorbance of the cell, buffer, and protein be between 0.4 and 1.0 (theoretically, 0.87 is optimal). • A spectra for secondary structure determination (260 - 178 nm) will require 30-60 minutes to record (plus an equivalent amount of time for a baseline as every CD spectrometer.
Sample Preparation and Measurement • Additives, buffers and stabilizing compounds: Any compound, which absorbs in the region of interest, (250 - 190 nm) should be avoided. A buffer or detergent, imidazole or other chemical should not be used unless it can be shown that the compound in question will not mask the protein signal. • Protein solution: The protein solution should contain only those chemicals necessary to maintain protein stability/solubility, and at the lowest concentrations possible. The protein itself should be as pure as possible, any additional protein will contribute to the CD signal. • Contaminants: Particulate matter (scattering particles), anything that adds significant noise (or artificial signal contributions) to the CD spectrum must be avoided. Filtering of the solutions (0.02 m syringe filters) may improve signal to noise ratio. • Data collection: Initial experiments are useful to establish the best conditions for the "real" experiment. Cells of 0.5 - 1.0 mm path length offer a good starting point.
CD Data Analysis • The difference in absorption to be measured is very small. The differential absorption is usually a few 1/100ths to a few 1/10th of a percent, but it can be determined quite accurately. The raw data plotted on the chart recorder represent the ellipticity of the sample in radians, which can be easily converted into degrees
CD Data Analysis • To be able to compare these ellipticity values we need to convert into a normalized value. The unit most commonly used in protein and peptide work is the mean molar ellipticity per residue. We need to consider path length l, concentration c, molecular weight M and the number of residues. in proper units (CD spectroscopists use decimol) which finally reduces to The values for mean molar ellipticity per residue are usually in the 10,000's
CD Data Analysis • The molar ellipticity [] is related to the difference in extinction coefficients Δε [] = 3298 Δε. • Here [] has the standard units of degrees cm2 dmol -1 • The molar ellipticity has the units degrees deciliters mol-1 decimeter-1.
Circular Dichroism of Proteins • It has been shown that CD spectra between 260 and approximately 180 nm can be analyzed for the different secondary structural types: alpha helix, parallel and anti-parallel beta sheets, turns, and other. • A number of excellent review articles are available describing the technique and its application (Woody, 1985 and Johnson, 1990). • Modern secondary structure determination by CD are reported to achieve accuracies of 0.97 for helices, 0.75 for beta sheet, 0.50 for turns, and 0.89 for other structure types (Manavalan & Johnson, 1987).
CD Signal of Proteins • For proteins we will be mainly concerned with absorption in the ultraviolet region of the spectrum from the peptide bonds (symmetric chromophores) and amino acid sidechains in proteins. • Protein chromophores can be divided into three classes: the peptide bond, the amino acid sidechains, and any prosthetic groups. • The lowest energy transition in the peptide chromophore is an n → p* transition observed at 210 - 220 nm with very weak intensity (emax~100). ----p* p → p* ~`190 nm emax~7000 ----n n →p 208-210, 191-193 nm emax~100 ----p
Comparison of the UV absorbance (left) and the circular dichroism (right) of poly-L-lysine in different secondary structure conformations as a function of pH. • The n →p* transition appears in the a-helical form of the polymer as a small shoulder near 220 nm on the tail of a much stronger absorption band centered at 190 nm. This intense band, responsible for the majority of the peptide bond absorbance, is a p→p* transition (emax ~ 7000). • Using CD, these different transitions are more clearly evident. Exciton splitting of the p →p* transition results in the negative band at 208 and positive band at 192 nm.
CD Spectra of Proteins • Different secondary structures of peptide bonds have different relative intensity of n →p* transitions, resulting in different CD spectra at far UV region (180 - 260 nm). • CD is very sensitive to the change in secondary structures of proteins. CD is commonly used in monitoring the conformational change of proteins. • The CD spectrum is additive. The amplitude of CD curve is a measure of the degree of asymmetry. • The helical content in peptides and proteins can be estimated using CD signal at 222 nm e222= 33,000 degrees cm2 dmol -1 res-1 • Several curve fitting algorithms can be used to deconvolute relative secondary structures of proteins using the CD spectra of proteins with known structures.
Protein CD Signal • The three aromatic side chains that occur in proteins (phenyl group of Phe, phenolic group of Tyr, and indole group of Trp) also have absorption bands in the ultraviolet spectrum. However, in proteins, the contributions to the CD spectra in the far UV (where secondary structural information is located) is usually negligible. Aromatic residues, if unusually abundant, can have significant effects on the CD spectra in the region < 230 nm, complicating analysis. • The disulfide group is an inherently asymmetric chromophore as it prefers a gauche conformation with a broad CD absorption around 250 nm.
Far UV CD Spectra of Proteins [] x10-3 degrees cm2 dmol -1
CD Spectra of Protein • Each of the three basic secondary structures of a polypeptide chain (helix, sheet, coil) show a characteristic CD spectrum. A protein consisting of these elements should therefore display a spectrum that can be deconvoluted into the three individual contributions.
CD Spectra Fit • In a first approximation, a CD spectrum of a protein or polypeptide can be treated as a sum of three components: a-helical, b-sheet, and random coil contributions to the spectrum. • At each wavelength, the ellipticity (θ) of the spectrum will contain a linear combination of these components: (1) • θT is the total measured susceptibility, θh the contribution from helix, θs for sheet, θc for coil, and the corresponding χ the fraction of this contribution.
CD Spectra Fit • As we have three unknowns in this equation, a measurement at 3 points (different wavelengths) would suffice to solve the problem for χ, the fraction of each contribution to the total measured signal. • We usually have many more data points available from our measurement (e.g., a whole CD spectrum, sampled at 1 nm intervals from 190 to 250 nm). In this case, we can try to minimize the total deviation between all data points and calculated model values. This is done by a minimization of the sum of residuals squared (s.r.s.), which looks as follows in our case :
Using CD to Monitor 3º Structure of Proteins • CD bands in the near UV region (260 – 350 nm) are observed in a folded protein where aromatic sidechains are immobilized in an asymmetric environment. • The CD of aromatic residues is very small in the absence of ordered structure (e.g. short peptides). • The signs, magnitudes, and wavelengths of aromatic CD bands cannot be calculated; they depend on the immediate structural and electronic environment of the immobilized chromophores. • The near-UV CD spectrum has very high sensitivity for the native state of a protein. It can be used as a finger-print of the correctly folded conformation.
Domain 1of CD2 CD2 is a cell adhesion molecules. Domain 1 of CD2 has a IgG fold. Nine b-strands form a beta-sandwich structure. Two Trp residues, W-7 and W-32 (green) are located at the exposed and buried region of the protein, respectively. Our lab has used CD2 as a model system to understand conformation flexibility of proteins
Conformational Change of CD2 6M GuHCl 25 ºC 85 ºC
Near UV CD Spectra of CD2 • CD2 losses its native well packed tertiary structure at high temperature and in 6M GuHCl 6 MGuHCl 85 ºC 25 ºC
Trp Fluorescence Emission Spectra of CD2 under Different Conditions • In a hydrophobic environment (inside of a folded protein), Trp emission occurs at shorter wavelength. When it is exposed to solvent, its emission is very similar to that of the free Trp amino acid (red shift occurs). Trp 25ºC 85ºC 6M GuHCl
CD2 vs. Helical Propensity • Residues on strands C, C’, C” and G have strong helical propensity.
Summary of CD • Circular dichroism spectroscopy is used to gain information about the secondary structure and folded state of proteins and polypeptides in solution. • Benefits: Uses very little sample (200 ul of 0.5 mg/ml solution in standard cells) Non-destructive Relative changes due to influence of environment on sample (pH, denaturants, temperature, etc.) can be monitored accurately. • Drawbacks: Interference with solvent absorption in the UV region Only very dilute, non-absorbing buffers allow measurements below 200 nm Absolute measurements subject to a number of experimental errors Average accuracy of fits about +/- 10% CD spectropolarimeter is relatively expensive
X-ray Crystallography • X-rays are electromagnetic radiation at short wavelengths, emitted when electrons jump from a higher to a lower energy state. • Growth of crystals • X-ray diffraction • Heavy-metal complex • Build model • Refinement
Drug design information Crystallization Structure analysis X-ray crystallography Model refinement Data collection Data procession http://www-structure.llnl.gov/xray/101index.html; http://www.aps.anl.gov/aps/frame_home.html
Crystal • A crystal is built up from many billions of small identical units, or unit cells. These unit cells are packed against ach other in three dimensions, much as identical boxes are packed and stored in a warehouse. The unit cell may contain one or more than one molecule. Although the number of molecules per unit cell is always the same for all the unit cells of a single crystal, it may vary between different crystal forms of the same protein. The diagram shows in two dimensions several identical unit cells, each containing two objects packed against each other. The two objects within each unit cell are related by twofold symmetry to illustrate that each unit cell in a protein crystal can contain several molecules that are related by symmetry to each other.
Many small identical blocks or unit cells are packed against other in 3D. In order to obtain a crystal, molecules must assemble into a periodic lattice. Each unit cell can contain several molecules that are related by symmetry. The diagram shows identical blocks, each containing two objects packed against each other. www.via.ecp.fr/~im/musee/escher.html
Crystals & X-ray Diffraction enzyme RuBisCo • Well-ordered protein crystals (a) diffract x-rays and produce diffraction patterns that can be recorded on film (b) (Laue photograph). The diffraction pattern was obtained using polychromatic radiation from a synchrotron source in the wavelength region 0.5 to 2.0 Å.
Protein Crystal Packing • Protein crystals contain large channels and holes filled with solvent molecules. The subunits (colored disks) form octamers of molecular weight around 300 kDa of glycolate oxidase, with a hole in the middle of each of about 15 Å in diameter. Between the molecules there are channels (white) ~ 70 Å in diameter through the crystal.
The Hanging-drop Method of Protein Crystallization • About 10 ml of a 10 mg/ml protein solution in a buffer with added precipitant --- such as ammonium sulfate, at a concentration below that at which it causes the protein to precipitate --- is put on a thin glass plate that is sealed upside down on the top of a small container. In the container there is about 1 ml of concentrated precipitant solution. Equilibrium between the drop and the container is slowly reached through vapor diffusion, the precipitant concentration in the drop is increased by loss of water to the reservoir, and once the saturation point is reached the protein slowly comes out of solution. If other conditions such as pH and temperature are conducive, protein crystals will form in the drop.
A Diffraction Experiment When the X-ray goes through the crystal, beams is diffracted and diffraction pattern is recorded on a detector. The crystal is rotated a certain degree while this pattern is recorded. A series of frames are collected. Determine the size of the unit cell by Bragg's law: 2dsinq = λ d= λ/(2* sinq). http://www-structure.llnl.gov/Xray/101index.html
A Diffraction Experiment • A narrow beam of x-rays (red) is taken out from the x-ray source through a collimating device. When the primary beam hits the crystal, most of it passes straight through, but some is diffracted by the crystal. These diffracted beams, which leave the crystal in many different directions, are recorded on a detector, either a piece of x-ray film or an area detector. The crystal was rotated one degree while this pattern was recorded. The pattern of RuBisCo was collected using polychromatic radiation.
Diffraction of X-rays by a Crystal • (a) When a beam of x-rays (red) shines on a crystal all atoms in the crystal scatter x-rays in all directions. Most of these scattered x-rays cancel out, but in certain directions (blue arrow) they reinforce each other and add up to a diffracted beam. Different sets of parallel planes (b) can be arranged through the crystal so that each corner of all unit cells is on one of the planes of the set. X-ray diffraction can be regarded as reflection of the primary beam from sets of parallel planes in the crystal, separated by a distance d. The primary beam strikes the planes at an angle q and the reflected beam leaves at the same angle, the reflection angle.
Diffraction of X-rays by a Crystal • X-rays (red) that are reflected from the lower plane have traveled farther than those from the upper plane by a distance BC + CD, which is equal to 2dsinq. • Reflection can only occur when this distance is equal to the wavelength l of the x-ray beam and Bragg's law (2dsinq = l). To determine the size of the unit cell, the crystal is oriented in the beam so that reflection is obtained from the specific set of planes in which any two adjacent planes are separated by the length of one of the unit cell axes. This distance, d, is then equal to l/(2sinq). The wavelength, l, of the beam is known since we use monochromatic radiation. The reflection angle, q, can be calculated from the position of the diffracted spot on the film, where the crystal to film distance can be easily measured. The crystal is then reoriented, and the procedure is repeated for the other two axes of the unit cell.
Diffraction of X-ray Beams • The reflection angle, q, for a diffracted beam can be calculated from the distance (r) between the diffracted spot on a film and the position where the primary beam hits the film. From the geometry shown in the diagram, the tangent of the angle 2q = r/A. A is the distance between crystal and film that can be measured on the experimental equipment, while r can be measured on the film. Hence, q can be calculated. The angle between the primary beam and the diffracted beam is 2q, as can be seen on the enlarged insert to the right. It shows that this angle is equal to the angle between the primary beam and the reflecting plane plus the reflection angle, both of which are equal to q.
Properties of Diffracted Waves • Two diffracted beams, each of which is defined by three properties: amplitude, which is a measure of the strength of the beam and which is proportional to the intensity of the recorded spot, phase, which is related to its interference, positive or negative, with other beams, and wavelength, which is set by the x-ray source for monochromatic radiation. • We need to know all three properties to determine the position of the atoms giving rise to the diffracted beams.
Multiple Isomorphous Replacement (MIR) • Heavy atoms (strong diffraction) are introduced into the unit cell of the crystal to obtain phase information by soaking crystals in the metal solution. • Intensity differences are used to deduce the positions of the heavy atoms in the crystal unit cell. Fourier summations of these intensity differences give Patterson maps of the vectors between the heavy atoms. • From the positions of the heavy atoms in the unit cell, we can get amplitudes and phases. • More than two different heavy-metal complexes are needed to give a reasonably good phase determination for all reflections.
Building a Model • The amplitude and phases of the diffraction data from the protein crystals are used to calculate an electron-density-map of the repeating unit of the crystal. • This map is then interpreted as a polypeptide chain with a particular amino acid sequence. • The resolution (in Å) is limited by the map error, resolution of the diffraction map. • At low resolution (5 Å or higher), the shape of the molecule can be obtained. • At medium resolution (~3 Å), the trace of the polypeptide chain, i.e. active site, can be obtained • At high resolution ( 2 Å), the a.a. sidechianscan be resolved.
Electron-density maps at different resolutionshow more detail at higher resolution. (d) 1.1 Å
Interpreting Electron-density Maps • The electron-density map is interpreted by fitting into it pieces of a polypeptide chain with known stereochemistry such as peptide groups and phenyl rings. The electron density is displayed on a graphics screen in combination with a part of the polypeptide chain (red) in an arbitrary orientation (a). The units of the polypeptide chain can then be rotated and translated relative to the electron density until a good fit is obtained (b).