Download
1 / 29
290 likes | 526 Views
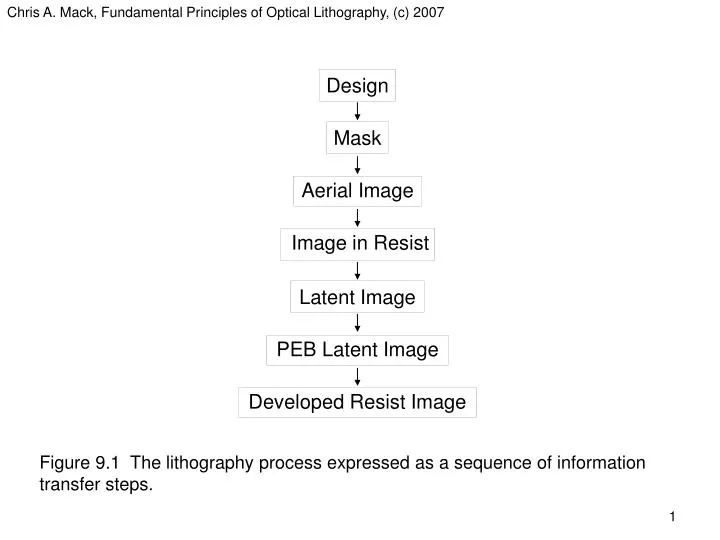
Design. Mask. Aerial Image. Image in Resist. Latent Image. PEB Latent Image. Developed Resist Image. Figure 9.1 The lithography process expressed as a sequence of information transfer steps.

E N D
Chris A. Mack, Fundamental Principles of Optical Lithography, (c) 2007 Design Mask Aerial Image Image in Resist Latent Image PEB Latent Image Developed Resist Image Figure 9.1 The lithography process expressed as a sequence of information transfer steps.
Chris A. Mack, Fundamental Principles of Optical Lithography, (c) 2007 Figure 9.2 Image contrast is the conventional metric of image quality used in photography and other imaging applications, but is not directly related to lithographic quality.
Chris A. Mack, Fundamental Principles of Optical Lithography, (c) 2007 Figure 9.3 Image Log-Slope (or the Normalized Image Log-Slope, NILS) is the best single metric of image quality for lithographic applications.
Chris A. Mack, Fundamental Principles of Optical Lithography, (c) 2007 (a) (b) Figure 9.4 The effect of defocus is to (a) ‘blur’ an aerial image, resulting in (b) reduced log-slope as the image goes out of focus (150 nm space on a 300 nm pitch, NA = 0.93, l = 193 nm).
Chris A. Mack, Fundamental Principles of Optical Lithography, (c) 2007 (a) (b) Figure 9.5 Using the log-slope defocus curve to study lithography: (a) lower wavelengths give better depth of focus (NA = 0.6, s = 0.5, 250 nm lines and spaces), and (b) there is an optimum NA for maximizing depth of focus (l = 248 nm, s = 0.5, 250 nm lines and spaces).
Chris A. Mack, Fundamental Principles of Optical Lithography, (c) 2007 Figure 9.6 Typical correlation between NILS and exposure latitude (simulated data, l = 248 nm, NA = 0.6, s = 0.5, 500 nm of UV6 on ARC on silicon, printing 250 nm lines and spaces through focus).
Chris A. Mack, Fundamental Principles of Optical Lithography, (c) 2007 Figure 9.7 One approach to the optimum stepper problem is the pick a fixed amount of defocus (0.2 mm) and find the settings that maximize the NILS (l = 248 nm, 130 nm lines on a 360 nm pitch, contours of constant NILS).
Chris A. Mack, Fundamental Principles of Optical Lithography, (c) 2007 (a) (b) Figure 9.8 Intensity reflectivity between air and resist of plane waves as a function of incident angle and polarization for a) resist on silicon, and b) resist on an optically matched substrate (l = 248 nm, resist n = 1.768 + i0.009868).
Chris A. Mack, Fundamental Principles of Optical Lithography, (c) 2007 Figure 9.9 Plot revealing the existence of an optimum exposure, the value of m at which the latent image gradient is maximized. Note that m = 1 corresponds with unexposed resist, while m = 0 is completely exposed resist.
Chris A. Mack, Fundamental Principles of Optical Lithography, (c) 2007 Figure 9.10 Bleaching (increasing values of Az) results in increased latent image gradient at the bottom of the resist (shown here is the special case where B = 0).
Chris A. Mack, Fundamental Principles of Optical Lithography, (c) 2007 Figure 9.11 Effect of diffusion on the latent image frequency components for a dense line.
Chris A. Mack, Fundamental Principles of Optical Lithography, (c) 2007 (a) (b) Figure 9.12 Increased diffusion (shown by the dimensionless quantity sD/L, the diffusion length over the width of the edge region) causes a decease in the latent image gradient (LIG) after PEB.
Chris A. Mack, Fundamental Principles of Optical Lithography, (c) 2007 Figure 9.13 For a chemically amplified resist with a given required amount of amplification, the exposure dose (and thus relative sensitizer concentration m) is optimum as the dose approaches zero (m 1), assuming negligible diffusion.
Chris A. Mack, Fundamental Principles of Optical Lithography, (c) 2007 Figure 9.14 Effect of diffusion on the latent image frequency components for a dense line, comparing pure diffusion (DPSF) to reaction diffusion (RDPSF).
Chris A. Mack, Fundamental Principles of Optical Lithography, (c) 2007 Figure 9.15 Including diffusion with amplification, there is an optimum PEB to maximize the latent image gradient (LIG), shown here relative to the maximum possible LIG. For this example, Kamp = 0.1 s-1, t = 200 s and the exposure dose is chosen to give the maximum gradient for each PEB time.
Chris A. Mack, Fundamental Principles of Optical Lithography, (c) 2007 (a) (b) Figure 9.16 The optimum value of a) the amplification factor, and b) the deblocked concentration in order to maximize the final latent image gradient, as a function of h.
Chris A. Mack, Fundamental Principles of Optical Lithography, (c) 2007 Figure 9.17 The optimum value of the final latent image gradient (relative to the image log-slope), as a function of h.
Chris A. Mack, Fundamental Principles of Optical Lithography, (c) 2007 Figure 9.18 The optimum value of the final latent image gradient (relative to the image log-slope), as a function of h for cases with and without quencher.
Chris A. Mack, Fundamental Principles of Optical Lithography, (c) 2007 (a) (b) Figure 9.19 The optimum value of a) the amplification factor, and b) the deblocked concentration in order to maximize the final latent image gradient, as a function of h for different quencher loadings.
Chris A. Mack, Fundamental Principles of Optical Lithography, (c) 2007 Figure 9.20 Numerically determined values of the critical h value (hc) for different quencher loadings.
Chris A. Mack, Fundamental Principles of Optical Lithography, (c) 2007 Figure 9.21 Typical development rate function of a positive photoresist (one type of HurterDriffield curve).
Chris A. Mack, Fundamental Principles of Optical Lithography, (c) 2007 Figure 9.22 One component of the overall photoresist contrast is the variation in development rate r with chemical species m*, shown here for the reaction-controlled version of the original kinetic development rate model (rmax = 100 nm/s, rmin = 0.1 nm/s).
Chris A. Mack, Fundamental Principles of Optical Lithography, (c) 2007 Figure 9.23 Development rate gradient with inhibitor concentration for the original kinetic development rate model (rmax = 100 nm/s, rmin = 0.1 nm/s, mth = 0.7).
Chris A. Mack, Fundamental Principles of Optical Lithography, (c) 2007 Figure 9.24 Photoresist contrast as a function of inhibitor concentration for the original kinetic development rate model, assuming no diffusion (rmax = 100 nm/s, rmin = 0.1 nm/s, mth = 0.7) and different values of the dissolution selectivity parameter n.
Chris A. Mack, Fundamental Principles of Optical Lithography, (c) 2007 Figure 9.25 The overall photoresist contrast (gamma) as a function of exposure dose (E) and amplification factor (af) for a chemically amplified resist with no diffusion (h = 0, rmax = 100 nm/s, rmin = 0.1 nm/s, n = 5, C = 0.05 cm2/mJ).
Chris A. Mack, Fundamental Principles of Optical Lithography, (c) 2007 Figure 9.26 A plot of equation (9.88) showing how the exposure latitude term approaches its limiting value of 2/NILS as the lumped photoresist contrast increases. In this case, the resist aspect ratio is 2, the ratio I(CD/2)/I(0) is 0.5 and the NILS is 2.
Chris A. Mack, Fundamental Principles of Optical Lithography, (c) 2007 Figure 9.27 SEM pictures of photoresist features exhibiting line edge roughness.
Chris A. Mack, Fundamental Principles of Optical Lithography, (c) 2007 (a) (b) Figure 9.28 Prediction of LER trends for a 45 nm feature using the generic conditions found in equation (9.99) and using three values of the deblocking reaction capture range a(0.5, 1, and 1.5 nm): a) assuming a 2-dimensional problem, and b) for a 3-dimensional problem.
Chris A. Mack, Fundamental Principles of Optical Lithography, (c) 2007 Table 9.1 Summary of lithography process steps and their corresponding information metrics.