Download
1 / 37
380 likes | 528 Views
Design. Designing is the creative activity of transforming the requirements into solutions The description of the solution is called the design and it is captured in a design document While creativity is very difficult to describe and teach, we can discuss it.

E N D
Design • Designing is the creative activity of transforming the requirements into solutions • The description of the solution is called the design and it is captured in a design document • While creativity is very difficult to describe and teach, we can discuss it.
Major Conceptual Tools used in Design • Abstraction: a representation of the essentials of something, with the details removed to allow the coping with and lessening of complexity • Synthesis: a combination of smaller, simpler parts into a larger component, dropping duplications and improving performance • Decomposition (or Modularity): a breakdown of a component into smaller and simpler sub-components, with more details shown at each lower level of decomposition. • Refinement: a successive expansion of the next level of detail.
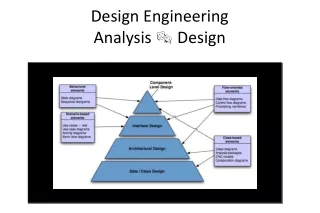
Designs • Data Design : • data structure, format, and flow • Architectural Design: • total system structural units, functional units within the structural units, and how they interact. • Interface Design: • interaction (data & control) among functional and structural units • Interaction between human and the system • Procedural Design: • Functional algorithms and the methodology to complete a specific function
Two Levels of Designs • Conceptual Design • Describes the functionality and characteristics of the solution system in a manner that the customers and users can understand and respond. • It describes a lot of the “what” of the solution • what are the incoming data and what is the format (data design) • what happens to the incoming data (data design) • what functions will process the data (procedural design) • what does the user have to perform ( interface design) • what are the system interfaces and what do they look like (interface design) • what are the user interfaces and what do they look like (interface design) • what is done to achieve the performance and availability targets of the system (architectural design, functional design, interface design)
Two Levels of Design (cont.) • Technical Design • Describes the functionality and the characteristics of the solution system for the system builders and implementers to understand and respond. • It describes a lot of the “how” of the solution • how does the data get captured and inputted • how is the data structured and processed along with which functions process it. • how would the users perform his or her functions • how do the system interfaces interact with each other and with what information • how do the user interfaces interact with system and the users and how are they created • how the system performance and availability functions are implemented
High Level Design • Often we have one High Level Design document for both the conceptual and technical designs • describes the major hardware, software, and human components and their : • individual attributes and what functions they perform • their relationships to each other • control • data • describes the major system input and output : • data format • timing and performance • describes the major user interfaces: • basic paradigm (e.g. menu driven, domain specific based, etc.) • size, format, defaults, etc. • required interactions with users
A Simple High Level Design Example • A “Power Function” Design: • Major Components: • hardware : any PC with 64 meg main memory and 1 gig storage, screen monitor, mouse, and keyboard, runs MS Windows, etc. • system software : MS Windows operating system • application software : Power Function application (more later) • user : interactive with the application through both mouse and keyboard to input the number and the power or to respond to the messages from the system. • System Input and outputs: • none between operating system and Power application except the I/O from the Power application to the screen. • application will be stored on the C-drive via the user directory
Simple High Level Design Example (cont.) • The “Power” function software will have three main sub-components: • input data validation • process the power function • display the output and messages • These three main “sub-components” interact as follows: • All input data will be validated by the input data validationsub-component. There are two input data: the number and the power. These two integers’ format and type will be validated and any message will be sent to the output display sub-component. Valid input will be sent to the power processing sub-component for processing. • Power process sub-component will receive the inputs from the input validation sub-component and compute the power. The result of the computation will be sent to the display sub-component to be displayed on the screen
Simple High Level Design Example (cont.) • Display and output sub-component will receive inputs from other sub-components, directing it to display the appropriate messages and outputs. U. I. Input Accepting and Validation (Validated input) User Process the Power Function (Error messages) (Valid output) or Display the messages & output (Error message)
Reminder on Conceptual Design Tools • In the design example we used all three concepts: • Abstraction of the Power Function (e.g. never discussed the actual algorithms nor the implications of negative power and imaginary number) • Decomposition (Modularity) of the Power function into three major sub-components, showing more details at the sub-component level, along with showing the interrelationship among the sub-components • Synthesis of each of the three sub-component, which performs its own specialized function, with as little duplication as possible • Refinement of the power function into subcomponent level.
Some Characteristics of Good Design • Consistent • Completeness (and Traceability) • Strong Cohesion • Loose Coupling
Consistency • Consistency of Design: • terminology across the system: • display screens • reports • database • processing • common handling of : • help • messages (error, warning, information, etc.) • failure detection and amount of diagnostics • recovery from failure or exceptions: “retry” - “correct’ - “report” • navigational style
Completeness and Traceability • Completeness of Design: • Each requirement has an associated design component(s) • Each design components has an associated requirement(s) * * * . * . . * . . Design Requirements * . * * . * . Design Requirements
Cohesion • The concept of cohesion deals with: • degree of “connection or relationship” within the component • degree of “bounding” or unison” within the component • A component design is considered better the more functionally cohesive that component is “internally” • clear focus on a problem • solution is targeted and thus simpler to construct, simpler to understand, and simpler to extend or modify • Object Oriented Technology with its combination of data and functions combined within an object is a natural for cohesion, assuming the choice of Class definition was good.
Degree or Levels of Functional Cohesion • There are 7 levels of functional cohesion as follows from lowest to the highest: (highest being the best) • 1. Coincidental • 2. Logical • 3. Temporal • 4. Procedural • 5. Communicational • 6. Informational or Sequential • 7. Functional
Degrees of Cohesion • 1. Coincidental is the lowest and the parts within the component are unrelated to one another. The only reasons that the parts are even found in the same component is due to convenience or accident. • 2. Logical is the next higher where several logically related actions are placed in the same component. These actions may be logically related, but not functionally related. • (e.g. one input routine for all unrelated functions or data.)
examples of “Logical” and “Temporal” degrees of Cohesion Temporal Cohesion (timing) Logical Cohesion Read Web inputs Process Inputs Perform all initializations “first” Process imports Read all transactions Perform business processing Perform all business processing Display query responses Perform all updates to DB “last” Output all acknowledg Process outputs Output error mess.
Degrees of Cohesion • 3. Temporal is the situation where the actions are related only for temporary timing reason. • (e.g. perform all initialization of data at the beginning or perform all error detection at one place in the end.) • 4. Procedural is the grouping of actions within a component because of some procedural sequence. • (e.g. read a data record from database and update a related but different record because of the business process.)
Examples of “Procedural” and “Communicational”degrees of Cohesion Communicational Cohesion Procedural Cohesion Business-flow 1 Business-flow n Request business input Request input Request input Validate input & process error Validate input Validate input Process normal business Process normal business Process normal business Read error table & process errors
Degrees of Cohesion • 5. Communicational is the case where possibly unrelated actions are taken on the same data or unrelated data are fetched together from a common file. • (e.g. using a primary search key and get employee data necessary for payroll processing but also get additional employee data such as employee educational information for some other processing which will come later.) • 6. Informational or Sequential is the situation where a number of related actions are performed based on output of one as input to another. • (e.g. initialize a record and then process the record)
Example of “Sequential” degree of Cohesionand “Functional” degree Sequential Cohesion Create a Team Assign Team Name Assign Team Members & Update member Functional Cohesion Team Function - create team ( ) -name team ( ) -delete team( ) -add member( ) -update member( )
Degrees of Cohesion • 7. Functional is the highest degree of cohesion where all the actions are directed towards one goal. The functional component achieves a single purpose. • This top level of functional cohesion was thought to also provide high reusability of that component for all similar requirements. • Because data can still change dramatically, it was not until object technology with inheritance came along even the functional cohesive module was still limited in reuse.
Measuring “Functional” Cohesion • Since functional cohesion is the “best’ situation, can we hone into it and describe it in more detail? • Bieman and Ott has worked on this and published a paper in IEEE Software Engineering journal in 1994. • The concept evolves around the notion of a “slice” of code that is associated with some specific function in a procedure. • A procedure may have several slices of code • Are these slices related ? • How these slices are related would give us a measure of “cohesion” of the procedure.
Some Definitions from Bieman and Ott • A Data token is any variable or constant • A Slice within a procedure is all the statements associated with (can affect the value of) some specific variable of interest. • A Data Slice is all the data tokens in the slice that will affect the value of the specific variable of interest. • Glue Tokens are all the tokens in the procedure that lie in more than one data slice. (note there can be the special situation of the procedure that has only one data slice) • Super Glue Tokens are the data tokens that lie in every data slice in the procedure.
Functional Cohesion Metrics from Bieman and Ott • Weak Functional Cohesion (WFC) : • Glue tokens / Total tokens • Strong Functional Cohesion (SFC) : • Super Glue tokens / Total tokens • Adhesiveness of a token t : • # of slices in the procedure that contain t / all the data tokens in the procedure
A pseudo-code example of Functional Cohesion metric Slice max: z1 n1 end1 max1 i1 end2 n2 max2 z2 01 i2 03 i3 end3 i4 z4 i5 max3 max4 z5 i6 max5 (22) Slice min: z1 n1 end1 min1 i1 end2 n2 min2 z3 02 i2 03 i3 end3 i4 z6 i7 min3 min4 z7 i8 min5 (22) Data Tokens: z1 n1 end1 min1 max1 i1 end2 n2 max2 z2 01 min2 z3 02 i2 03 i3 end3 i4 z4 i5 max3 max4 z5 i6 z6 i7 min3 min4 z7 i8 max5 min5 (33) Glue Tokens: z1 n1 end1 i1 end2 n2 i2 03 i3 end3 i4 (11) Super Glue: z1 n1 end1 i1 end2 n2 i2 03 i3 end3 i4 (11) Finding the maximum and the minimum values procedure: MinMax ( z, n) Integer end, min, max, i ; end = n ; max = z[0] ; min = z[0] ; For ( i = 0, i = < end , i++ ) { if z[ i ] > max then max = z[ i ]; if z[ i ] < min then min = z[ i ]; } return max, min;
Functional Cohesion Metrics from code example • Weak Functional Cohesion (WFC) : • Glue tokens/ Total tokens = 11/33 • Strong Functional Cohesion (SFC): • Super Glue tokens / Total tokens = 11/33 (same as above) • Adhesiveness of a token t : • # of slices in the procedure that contain ‘z’ / all the data tokens in the procedure = 2/ 33
Modify MinMax Function • From the MinMax procedure, pull out all of the code dealing with minimum and get just the maximum function. • There will just be one slice containing 22 data tokens • The 22 tokens also form the whole procedure • Thus WFC = SFC = 22/22 = 100% ! • The same result may be obtained by pulling out maximum function code out of the MinMax and just perform minimum fucntion. • We can improve the Functional Cohesion by making the procedure “single” functional.
Coupling • The concept of Coupling deals with the degree of inter-dependence of components. The inter-dependence may be : • asynchronous passing of controls • synchronous passing of controls • passing of data between components • combination of passing controls and data with embedded semantics • It is believed that a design is better the looser or lesser the coupling is among its components.
Degree or Levels of Coupling • There are 6 levels of coupling as follows (the lowest or the second lowest being the best) : • 6. Content coupling • 5. Common coupling • 4. Control coupling • 3. Stamp coupling • 2. Data coupling • 1. Uncoupled
Degrees of coupling • Content coupling is the least desirable in that one component directly references or has access to the contents of another component. • (e.g. a pointer is passed from one component to another where the pointer may be used to change the content of another component. Also unintended incrementing of the pointer may get to unanticipated areas and cause the MS’s famous “gpf”.) • Common coupling is the case where a common global data is used. • (e.g. the common repository design style is a case where all the communicating modules depend on the status and integrity of a common data.)
Degree of Coupling • Control coupling is the situation where one component passes a data to another but the data has embedded semantics that controls the processing of the receiving component. • (e.g. Component A passes an information that says “I can not complete my processing --- and you should issue error message x in French.”) • Stampcoupling is the passing of the complete data structure when only some the data element is needed. • (e.g. passing of a pointer to the complete data structure as opposed to just the needed data elements causing the receiving component to possibly access the wrong elements.)
Degree of Coupling • Data coupling is the case where only the necessary information is passed from one component to another. This is the most desirable coupling if there must be some coupling which almost all system must have. • Uncoupledis the case where there is no coupling at all. Very unlikely situation for any medium to large systems.
Fan-in and Fan-out • An assessment of characteristics of good high level design is the measure of Fan-in and Fan-out • Fan in of a component is the number of flows into a component and the number of global data structure accessed by the module. . . . . . . . . Component with multiple Fan-ins
Fan-in and Fan-out • Fan-out of a component is the number of flows out of a component and the number of global data structures updated by the module. Component with multiple fan-outs . . . . . . . .
Measure of Fan-in & Fan-out • There are several formulae relating the number of fan-ins and fan-outs of the components of a design to the complexity of a design. • It is also believed that generally a component with high number of fan-outs may be a concern. • A component with high number of fan-outs needs to account for more parameter passing, more data structures, more control transfers. Therefore it is more complex and also requires more testing. • A component with high number of fan-ins can still be quite self containing. It, itself, is not any more complex, and it also gets tested more as the multiple fan-in components are tested.
Dharma’s module coupling Indicator • This one involves several (8) parameters • Input control (ic) • Input data (id) • Output data (od) • Output control (oc) • Global variables (used as data) (gd) • Global variables (used as control) (gc) • Fan-out number (fo) • Fan-in numbers (fi) • The index is a linear summation of some proportion of these parameters. • Mc=k/(id+2*ic+od+2*oc+gd+2*gc+fo+fi) • Not popularly recognized or used