Download
1 / 32
320 likes | 323 Views
This seminar explores the dynamics of global land transitions, land use, and land cover, and their impacts on human and ecological systems. It examines the role of human decision-making, institutions, culture, technology, and population in shaping landcover changes. It also addresses economic and ecological problems such as poverty, unequal wealth distribution, pollution, diseases, food/fiber/fuel shortages, and overcrowding. The seminar discusses the importance of ecosystem goods and services, including clean air/water, waste recycling, food/fiber/fuel production, and recreation. Uncertainties in forest monitoring, global land cover classification, and landcover change patterns are also explored.

E N D
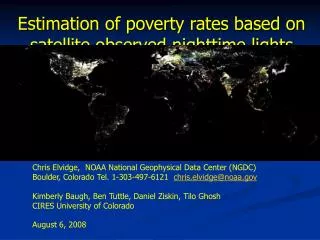
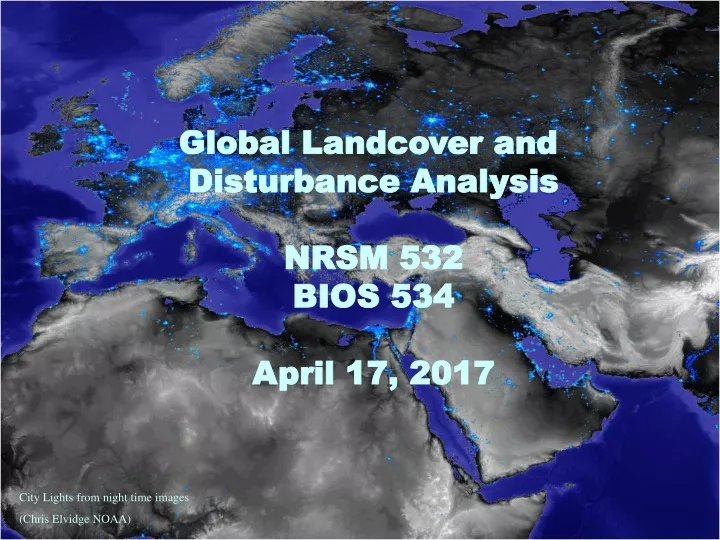
Global Landcover and Disturbance Analysis NRSM 532 BIOS 534 April 17, 2017 City Lights from night time images (Chris Elvidge NOAA)
DYNAMIC GLOBAL LAND TRANSITIONS LANDUSE [Human control] LANDCOVER [Biophysically controlled] -Biogeochemistry-Genetic bank-Water-Air Human Systems Ecological Systems HUMAN DECISION MAKING political/economic choices -Institutions Culture Technology Population Economic Economic Problems -poverty -unequal wealth -war -globalization Ecological Problems • pollution • diseases • food/fibre/fuel shortages • overcrowding Ecosystem goods & services • clean air/water • waste recycling • food/fibre/fuel • recreation
The world’s forests: take your pick > 60% IGBP Closed forest >10% FAO Official definition > 40% - Forestry definition UNBC Seminar
Cartoon of Bush 1st UNBC Seminar
Uncertainties concerning forest monitoring • Different definitions and protocols between and within countries. • Very varying national capabilities to monitor forests and land cover. • Remote sensing data are often unavailable • Costs • Satellite acquisition strategies • Internationally published results yield uncertain results. • No current commitment for many key products and services. UNBC Seminar
Global land cover classification (8 km resolution) Key: 1: Evergreen Needleleaf Forests 2:Evergreen Broadleaf Forests 3: Deciduous Needleleaf Forests 4: Deciduous Broadleaf Forests 5: Mixed Forests 6: Woodlands 7: Wooded Grasslands/Shrubs 8: Closed Bushlands or Shrublands 9: Open Shrublands 10: Grasses 11: Croplands 12: Bare 13: Mosses and Lichens UNBC Seminar
MODIS 500 meter continuous field result for the lower 48 United States Comparing results with USFS forest area estimates by state Percent tree cover threshold at which continuous field area estimate matches USFS estimate. Note much lower threshold used in south west UNBC Seminar
MOD12Q2: Global Vegetation Phenology From Mark Friedl, Boston Univ. First global products for vegetation phenology based on MODIS EVI data released for 2001-2004 • Identifies key transition dates in growing season Onset EVI maximum Onset EVI increase Onset EVI minimum Onset EVI decrease
The difference between potential” and “actual” landcover and the role of humans UNBC Seminar
23 March 2001, p. 2294. UNBC Seminar
New York Times June 11, 1992 UNBC Seminar
August 15, 1992 September 12, 1999 Land Cover Classification Forest Cover Lost 92 Km2 4,5,3 (RGB) 049-022 Landsat ETM+ 4,5,3 (RGB) 049-022 Landsat TM Percent Forest Lost 10% Forest Lost/Year 13.1 Km2 British Colombia, Canada:The bright blue patches are areas of mostly bare ground left after logging. While clearcuts in the 1992 image have likely been replanted, the limited red return from these patches in the 1999 image demonstrate how slowly forest regenerates in these environments. This 1169 Km2 region lost 92 Km2 of forest (10%) from 1992-1999. 1992 - 1999 Research Partners UNBC Seminar
Clearing Epoch 1985-88 1988-91 1991-95 1995-99 1999-01 Undisturbed Forest Landsat Disturbance History Example: Virginia
Global Forest Cover Change 2000 - 2012 Hansen, M. et al. Science 2013
GLOBAL Generalized Disturbance Index Mildrexler et al 2006 Mildrexler et al 2006
Comparison of Land Surface Temperatures from Aqua MODIS Sahara Desert vs central African Tropical Forest Mildrexler, Zhou, Running. AGU Eos 87:461, 2006
Aqua MODIS Maximum Annual Land Surface Temperature (2003-2009) Mildrexler, Zhou, Running. AGU Eos 87:461, 2006
Comparison of Land Surface Temperatures from Aqua MODIS Irrigated Poplar vs arid Sagebrush, central Oregon Mildrexler, Zhou, Running. AGU Eos 87:461, 2006
700 Relative Change CO2 Concentration (ppm) 360 2000 2150 2100 Year Time Lag in Biospheric Responsesto Changing Climate Phenology, NPP CO2 Disturbance Biome Shifts Land Temperature