Download
1 / 17
170 likes | 299 Views
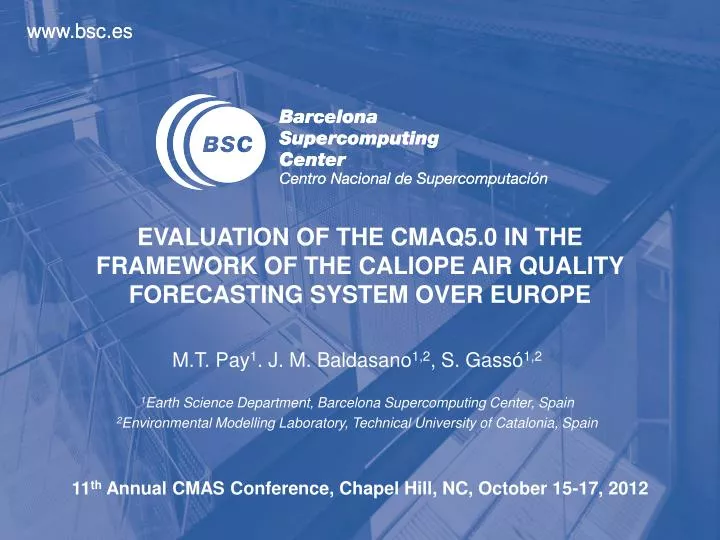
Evaluation of the CMAQ5.0 in the framework of the CALIOPE air quality forecasting system over Europe. M.T. Pay 1 . J . M. Baldasano 1,2 , S. Gassó 1,2 1 Earth Science Department , Barcelona Supercomputing Center, Spain

E N D
Evaluation of the CMAQ5.0 in the framework of the CALIOPE air quality forecasting system over Europe M.T. Pay1. J. M. Baldasano1,2, S. Gassó1,2 1Earth ScienceDepartment, Barcelona Supercomputing Center, Spain 2Environmental Modelling Laboratory, Technical University of Catalonia, Spain 11th Annual CMAS Conference, Chapel Hill, NC, October 15-17, 2012
Introduction • European cities undergo frequent photochemical pollution episodes which exceed the European air quality targets (EEA, 2010). (especially NO2, PM10 and PM2.5) • Air quality modelling is both a challenge and a scientific problem, being one of the requirements of the 2008/50/EC Directive. • Reliable air quality forecasts: exposure is more efficiently reduced and better protection can be ensure by means of information and short-term action plans. Air pollution in the Barcelona city (Spain). Source: El País. Air pollution in the Madrid city (Spain), 8 February 2011. Source: El País.
Objective In the European context, CALIOPE is an air quality forecasting system (CALIOPE AQF) -based on WRF-ARW/HERMES/CMAQ/BSC-DREAM8b models and implemented in the MareNostrum supercomputer- (Baldasano et al., 2008, ASR) which provide daily forecast for Europe and Spain. This work compares the two version of the CMAQ Chemical Transport Model versions 4.5 and 5.0 (both integrated in the CALIOPE AQF). The CMAQ version 5.0 includes scientific improvements for gas-phase chemistry (CB05) and aerosol, especially devoted to SIA and SOA and aerosol dynamic (fine-coarse). The mail goal is to examine the differences between both CMAQ versions in terms of the main pollutants O3, NO2 and PM10 (and their chemical composition) when they are applied to the European region with high resolution for the forecasted April 9th -7th June 2012.
The CALIOPE system (http://www.bsc.es/caliope/) Domains: • EU = 12 km x 12 km (480 x 400 grid cells) • IP = 4 km x 4 km (399 x 399 grid cells) Modules • Meteorology: WRF-ARW v3.0.1.1, • EU = IC & BC: GFS/FNL (NCEP) • IP = one-way nesting • 38 sigma levels (50 hPa) • Emissions: HERMES-EMEP • EU = Disaggregation from EMEP inventory. • IP = HERMES model bottom-up. • Chemical Transport Model: CMAQv4.5 • EU = BC: LMDz-INCA2 • IP = one-ways nesting • 15 sigma levels (50 hPa) • CBIV, Cloud chem., AERO4 • Mineral dust from Africa: BSC-DREAM8b • Model evaluation: • Near-real time • Kalman filter post-processing
Confidence on the CALIOPE system (based on CMAQ4.5) 2. Near-Real Time (NRT) evaluation: 1. Peer Review Publications:
Evaluation methods AirBase ground-level concentrations • Background rural/suburban stations • Gaseous and particulate matter: O3, NO2, and PM10. • Online (NOT VALIDATEDDATA) • Evaluation in forecast mode comparing CMAQv4.5 vsCMAQv5.0 against air quality measurement from the online AirBase monitoring network(the European Air Quality dataBase) for the period: from April 9th till 7th June 2012.
NO2 hourly evaluation at AirBase stations: examples • At SUBURBAN stations under the influence traffic emission peaks are reduced around 10-20 µg m-3. • Background levels remain without changes. • At RURAL stations different between version are less than 10 µg m-3.
O3 hourly evaluation at AirBase stations: examples • With CMAQ5.0 O3 bias reduction on daily cycle: • daily peaks ~10-20 µg m-3 • night minimum ~10-30 µg m-3 • This is favoured in part by the high peaks of NO2.
Differences in O3 and NO2: 12/05/2012 Bias (µgm-3) CMAQv5.0 – CMAQv4.5 CMAQv4.5 CMAQv5.0 NO2 O3
PM10 hourly evaluation at AirBase stations: examples • With CMAQ5.0, PM10 bias reductions against AirBase: • Background levels ~5µg m-3. • Daily peaks ~10-20 µg m-3. • This is favoured in part by the improvement in AERO5 (aerosol dynamic, thermodynamic, etc.)
Differences in PM10: 12/05/2012 Bias (µgm-3) CMAQv5.0 – CMAQv4.5 CMAQv4.5 CMAQv5.0
Differences in PM10 components: 12/05/2012 Bias (µgm-3): CMAQv5.0 – CMAQv4.5 SIA PPM CMAQv5.0 SOA SS
Global statistical evaluation from April 9th till 7th June 2012 Spatial correlation (r) RMSE (µg m-3) • For O3, the highest improvements with CMAQv5.0 are found at SB stations where r increases from 0.42 to 0.54 and RMSE decreases by ~1 µgm-3. • Concerning NO2 model performance, r and RMSE do not show significant improvements between both CMAQ versions, but mean bias improves by 18%in CMAQ5.0 respect CMAQ4.5 • For PM10, relatively improvements of r by 24% for all the stations, and reduction of RMSE by ~3 µgm-3 using CMAQv5.0, which represents a reduction of 13% in the error. Significant improvements at RB stations, where r increases by 45% and RMSE is reduced by ~5 µgm-3 (26% reduction). O3 NO2 PM10
Bias correction techniques (Kalman filter) • Overall the bias-adjustment technique is more effective over CMAQv5.0 than over version 4.5 • The pollutant with the highest improvement is O3. r for all stations increases till 0.53 with CMAQv5.0 after applying KF, meanwhile r reach 0.43 with CMAQ4.5 with the same bias-correction. • The NO2 performance after applying KF demonstrate significant relative improvements compared to O3, mostly because the original modeling system skills are lower for this pollutant. • For PM10, KF presents a higher relative improvement applied over CMAQ5.0 than over version 4.5, with an increasing of 19% in r (from 0.36 to 0.43) and a decrease of 15% in RMSE (from 18.1 µgm-3 to 15.4 µgm-3).
Summary The first evaluation results (April 9th till 7th June 2012) of the two CMAQ versions 4.5 and 5.0, both integrated in the AQF CALIOPE system, indicate: • For NO2, CMAQv5.0 reduces mean bias (r and RMSE do show significant improvements): • Bias reduction of forecasted NO2 peaks (~10-20 µgm-3) at SUBURBAN stations with CMAQ5.0. • Positive biases (CMAQ5.0-CMAQ4.5): > 10 µgm-3 along shipping routes and 10-15µgm-3. over important emission sources. • For O3, CMAQv5.0 improves forecast daily cycle: • Especially at night-time over SUBURBAN stations, where O3 biases are reduced between 20 and 30 µgO3m-3 = positive impact of NO2 performance. • Positive biases (CMAQ5.0-CMAQ4.5): 15-25 µgm-3in the Mediterranean Sea and 6-15 µgm-3downwind important NOx emission sources. • For PM10, CMAQv5.0 improves statistics (r, RMSE, and especially bias). • Episodes of secondary aerosol formation are now reproduced (i.e. 7-14th May 2012) where daily peaks are reduced in ~10-20 µgm-3. • Positive biases (CMAQ5.0-CMAQ4.5): > 12 µgm-3over Mediterranean Sea (mainly SS) and 4-6 µgm-3 inland background conc. (mainly SIA ~3µgm-3 and PPM > 4 µgm-3). • Bias-adjustment technique based on Kalman filter is more effective over CMAQv5.0. The scientific improvements included in CMAQv5.0 contribute to INCREASE: (1) the knowledge about air quality over Europe, and (2) the confidence on CALIOPE AQF
Webs: • Daily Operational Air Quality Forecasts Europe/Iberian Peninsula: http://www.bsc.es/caliope • Daily BSC-DREAM8b mineral dust model forecasts North Africa/Europe/East-Asia: http://www.bsc.es/projects/earthscience/DREAM/ Some references: Baldasano, J.M., et al., 2011. An annual assessment of air quality with the CALIOPE modeling system over Spain. Sci. Total Environ., 409, 2163-2178. Pay, M.T., et al., 2012. Spatio-temporal variability of levels and speciation of particulate matter across Spain in the CALIOPE modeling system. Atmospheric Environment46, 376-396 (2012). Sicardi et al., 2012. Assessment of Kalman filer bias-adjustment technique to improve the simulation of ground-level ozone over Spain. Sci. Total Environ.416, 329-342. Thank you for your attention