Download
1 / 13
130 likes | 203 Views
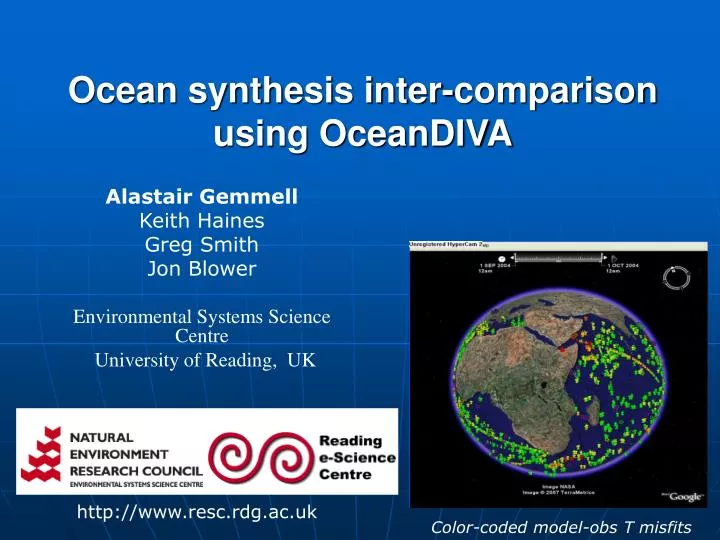
D D D s. Ocean synthesis inter-comparison using OceanDIVA. Alastair Gemmell Keith Haines Greg Smith Jon Blower Environmental Systems Science Centre University of Reading, UK. http://www.resc.rdg.ac.uk. Color-coded model-obs T misfits. Outline.

E N D
D D D s Ocean synthesis inter-comparison using OceanDIVA Alastair Gemmell Keith Haines Greg Smith Jon Blower Environmental Systems Science Centre University of Reading, UK http://www.resc.rdg.ac.uk Color-coded model-obs T misfits
Outline • Methods – OceanDIVA – a Java web application to visualize and compare gridded model data, and in-situ pointobservations • Geospatial representation of the data. • Statistical representation of the data • Conclusions
Input data can be local to the web service or read in remotely via OPeNDAP protocol OceanDIVA – Ocean Data Inter-comparison and Visualization Application • For this study: • Used EN3 (ENACT/ENSEMBLES) observations dataset • Compared a range of CLIVAR GSOP ocean syntheses accessible via OPeNDAP • Analysed Sept ’04 (Sept ’01 for syntheses finishing before ‘04)
Minimum bin content = 2 Minimum bin content = 3 Probability Density Functions (PDFs) Covering the north Pacific. Model is Reading ¼ degree • Binned data into bins of 10m by 0.2oC • Blues = bins with lower data density • Reds = bins with higher data density • Data density normalised to depth level Minimum bin content = 1
Observed Depth Probability Density Functions (PDFs)Covering the north Pacific. Model is Reading ¼ degree Depth Temperature Misfit Salinity Misfit Temperature Depth Misfit Salinity Misfit
Regional VariabilityThis example: Reading ¼ degree model showing S(T) Atlantic Obs. Misfit Pacific Obs. Misfit North Trop. South
North Pacific z(T) across syntheses World Ocean Atlas ‘05
Bias v Standard DeviationNorth Pacific – z(T) – over T range 12-22 oC 25 Misfit Std. Dev. (m) 65 50 0 Misfit Mean (m) CERFACS ‘01 ECCO-GODAE ECCO-JPL ECCO-SIO ‘01 ECMWF GECCO ‘01 GFDL INGV ‘01 MERCATOR Reading 1o control Reading 1o assim. Reading ¼o control Reading ¼o assim. SODA WOA 2005
North Pacific S(T) across syntheses ECCO-GODAE
Bias v Standard DeviationNorth Pacific – S(T) – over T range 5-17 oC 0.05 Misfit Std. Dev. (PSU) 0.13 0.14 0.0 Misfit Mean (PSU) CERFACS ‘01 ECCO-GODAE ECCO-JPL ECCO-SIO ‘01 ECMWF GECCO ‘01 GFDL INGV ‘01 MERCATOR Reading 1o control Reading 1o assim. Reading ¼o control Reading ¼o assim. SODA WOA 2005
Bias v Standard DeviationNorth Pacific – S(T) – over T range 17-30 oC 0.04 Misfit Std. Dev. (PSU) 0.11 0.08 0.0 Misfit Mean (PSU) CERFACS ‘01 ECCO-GODAE ECCO-JPL ECCO-SIO ‘01 ECMWF GECCO ‘01 GFDL INGV ‘01 MERCATOR Reading 1o control Reading 1o assim. Reading ¼o control Reading ¼o assim. SODA WOA 2005
Conclusions • OceanDIVA is a useful tool for visualizing data, and comparing model data with observations. • Useful for validation in fields of • Ocean reanalyses • Operational oceanography • Outputs shown which appear to reflect differences between synthesis techniques – e.g. methods of data assimilation. • E.g. mode waters, S(T) relationships • Interesting Future work planned including • different and longer time periods • using isopycnals • more syntheses. • Provided correct metadata and standards are used, there is the exciting prospect of increasing amounts of data available on OPeNDAP servers etc, leading to more collaborative work and comparisons being carried out.