Download
1 / 28
320 likes | 537 Views
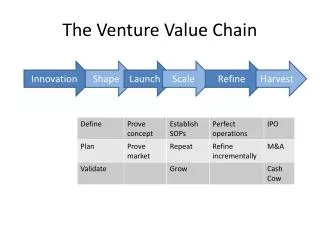
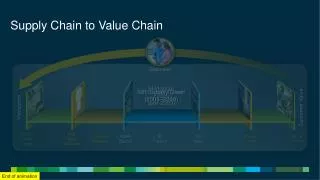
The Hydrocarbon Value Chain: Business Process and Performance James McCoy General Manager, Petroplus Marketing AG. The Hydrocarbon Value Chain. The Assets. Stations and C-Stores. Secondary Distribution. The Brand. Primary Distribution. Refining. Logistics. Exploration & Production.

E N D
The Hydrocarbon Value Chain:Business Process and PerformanceJames McCoyGeneral Manager, Petroplus Marketing AG
The Hydrocarbon Value Chain The Assets StationsandC-Stores SecondaryDistribution TheBrand PrimaryDistribution Refining Logistics Exploration & Production ProductsDealer Tank Wagon BulkProducts AtTerminal BulkProducts InTransit SpotProducts CrudeMarketsCIF CrudeMarketsFOB The Markets
A Pure Demand-Pull Value Chain No Sales?Trades?Buys? No Bulk Sales?Wholesalers?Retailers? Volume Signal Suppliers Logistics Manufacturing Distribution End Consumer
The Hydrocarbon Value Chain Market Market Market Market Market Existence of markets allows for arbitration of the normalvolume signal StationsandC-Stores SecondaryDistribution Supply Push TheBrand PrimaryDistribution Refining Demand Pull Logistics Exploration & Production
The Hydrocarbon Value Chain Option to Sell Option to Ship, Process Option to Buy StationsandC-Stores SecondaryDistribution Supply Push TheBrand PrimaryDistribution Refining Demand Pull Logistics Exploration & Production
A Generic Value Chain Planning Process Potential Variation in the System Final Outcome The “Event” + - Forecast(Heads-up) n-3 Plan(Getting Prepared) n-2 Schedule(Executing) n-1 Measure and Control(Firefighting) n Post-Audit(Learning) n+1
Observations • “Make what you sell, sell what you make” isn’t necessarily true • “Make,” “buy,” or “sell” decisions occur at each step in the value chain • Decisions are made for future events, so processes and tools must match StationsandC-Stores SecondaryDistribution TheBrand PrimaryDistribution Refining Logistics Exploration & Production
Financial Optimization of Assets The vertebrae of the value chain backbone RetailMarketing SecondaryDistribution Marketing PrimaryDistribution Manu-facturing CrudeTrans-portation Stations &C-Stores Exploration & Production TruckFleet The Brand Pipelines Refineries Ships,Pipelines Reserves
Refinery Asset: Some Characteristics • Engineered facility with limited flexibility • Initial design optimized for particular crude and product slate • The Theory of Constraints Applies To Gross Margin • Typically represented by model due to complexity. Main elements: • Process Unit Sub-Models • Stream Routing • Product Specification Tables • Blending Equations • High Fixed Costs Approaching 70% of Total Cash Costs • Variable Costs Are Largely Energy • Very High Capital Employed • PPE will most likely be in billions of US Dollars • Working capital will most likely be 20-30 days
Low Margin, High Volume Global Business… US North- South- North- Gulf west east west Coast Europe Asia Europe US Dollar/bbl % Revenues Aug-11 Product Revenues 121.42 123.48 118.24 100% Feedstock Costs -110.03 -113.94 -110.97 92% Gross Margin 11.39 9.54 7.27 8% Variable Costs -2.23 -2.51 -1.95 2% Margin On Variable Costs 9.16 7.03 5.32 6% Fixed Costs -1.16 -1.68 -1.88 1% Cash Operating Margin 8.00 5.35 3.44 4% Historical 2011 YTD 7.7 4.20 3.00 2010 average 4.46 3.50 0.50 2009 average 3.04 2.01 0.27 2008 average 9.09 7.34 1.77 2007 average 12.6 5.75 2.25 2006 average 12.54 5.88 0.90
Yield On Crude C1-C4 Gas Light Naphtha Heavy Naphtha Kerosene Gasoil VGO Residue Source: TOTAL Crude Oil Marketing
Yield In Hydroskimming Refinery LPG Mogas+Naphtha Kerosene Gasoil Fuel Oil Source: TOTAL Crude Oil Marketing
Yield In Cracking Refinery LPG Mogas+Naphtha Kerosene Gasoil Fuel Oil Source: TOTAL Crude Oil Marketing
Asset Optimization: Typical Models • Crude Assay and Assay “cutter” • Provides “technical value” for the crude oil • Ignores constraints and synergies • Linear Programing Model • Considers constraints and synergies. • Attempts to saturate as many constraints to derive maximum value. • Incremental or marginal analysis; therefore only variable costs. • First Principles Model • Similar to Linear Programing Model • Almost never used for economic optimization • Other Models-Scheduling Tools • Makes translation from continuous to batch • Includes inventory effects, batch size, timing
Asset Optimization: Use Of Models • How do you demonstrate that: • The tool is pointing to the optimum? • The users understand why? Capability of the Tool Capability of the Computer
Observations: Right Organization, Priority, Tools, People • Clear division of labor between optimization and scheduling activities • The two efforts are linked, e.g. constraints, but must demand recognition that the optimizer drives the scheduler • Use right tool for the job • Typically Linear Program for optimization • Scheduling and inventory tools for translation to batch • Error control in sub-models and model structures • No a priori method to check model accuracy • Monthly KPIs, followed by well-defined corrective process • Management discipline, resources and focus to • Maintain KPIs • Maintain a team of expert users-because: Understanding the results is more important than the results themselves
Extracting Money from Markets The discs of the value chain backbone StationsandC-Stores SecondaryDistribution TheBrand PrimaryDistribution Refining Logistics Exploration & Production Branded/Unbranded in Truck BulkProducts atTerminal BulkProducts inTransit SpotProductMarkets CrudeMarketsCIF CrudeMarketsFOB
Market Approaches: Examples Volume Signal Transfer PricesNo Relationship To Market Market Asset Optimization Market Prices-All Volumes Market Prices-Volumes Market Prices-Volume-Time Pure Speculation
Internal “Free” Market Market curve based on knowledge of markets Internal value curvebased on knowledge ofassets Price Volume Value Creation=Sell Value Creation=Run
Observations • The combination of market knowledge and assets can create greater value • Functional “silos” don’t really matter • Having a common language does matter • Economics with price-volume-time • An internal “free market” requires • Accountability • Transparency
Overall Value Chain: Petroplus Example Market Market Market Market StationsandC-Stores Supply Push SecondaryDistribution TheBrand PrimaryDistribution Refining Logistics Exploration & Production Demand Pull
Work Processes and Organization • Many companies including Petroplus have evolved to the role of “senior economic pilot” “Traders” or Commodity Managers Refinery PILOT Senior PILOT Refinery Management Team Markets
“Economic Pilot” Resposibilities • Setting and Re-setting the course that the operational departments follow to optimize overall profitability • Establish realistic but challenging goals by understanding compromise between external and internal factors • Maintain focus on meeting or beating the economic plan and understanding the alternatives.
“Trader” or Commodity Manager Decision Rights • Buy Smart • Sell Smart • Manage Risk • Determine Inventory (Working Capital) Required to Execute Plan • Create Knowledge • Determine Assets Required to Execute Strategy
“Trader” or Commodity Manager Capabilities • Market Analysis • Developing a Point-of-View (on the market) • Development and Ownership of a Strategy • Negotiation • Planning
Summary • Create value using a combination of market knowledge and assets • Understand your approach to the value chain; i.e., your business model • Define work processes first • They may be unique • Define the Organization and Decision Rights • Define the tools