Download
1 / 6
70 likes | 242 Views
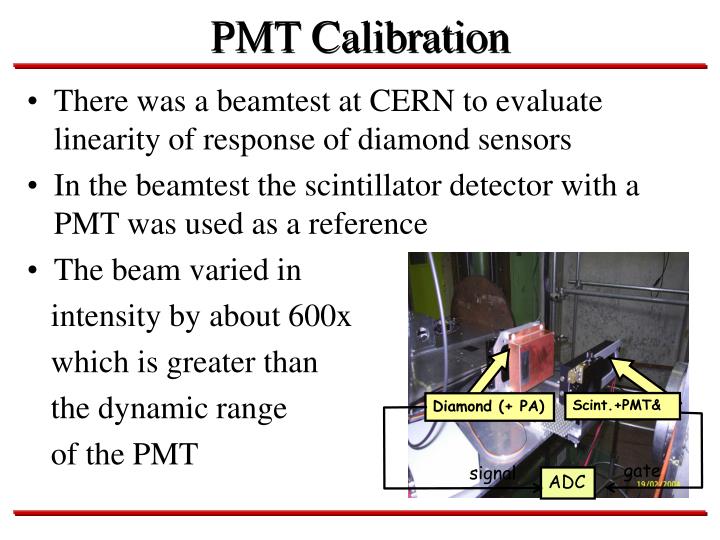
Scint.+PMT&. Diamond (+ PA). gate. signal. ADC. PMT Calibration. There was a beamtest at CERN to evaluate linearity of response of diamond sensors In the beamtest the scintillator detector with a PMT was used as a reference The beam varied in intensity by about 600x

E N D
Scint.+PMT& Diamond (+ PA) gate signal ADC PMT Calibration • There was a beamtest at CERN to evaluate linearity of response of diamond sensors • In the beamtest the scintillator detector with a PMT was used as a reference • The beam varied in • intensity by about 600x • which is greater than • the dynamic range • of the PMT
PMT Calibration • We have to change supply voltage of the PMT to accommodate this dynamic range. The PMT also showed some saturation at high signal levels • To evaluate the linearity of the diamond sensor we need now to calibrate PMT over the whole dynamic range of intensities • To do so, we have used LED illumination PMT LED
PMT Calibration • The intensity of light is assumed to be proportional to the 1/r2 • Where r is the distance between LED and PMT yr2 y0r02
PMT Calibration • The saturation effect shows • at signal level of about • 600 ADC channels • Also, at small distances • we see some effects due • to geometry, because LED • is not a point source
PMT Calibration • To distinguish between this effects we have made the same measurements with different LED intensity • The saturation effect is also illustrated by varying • the LED current
PMT Calibration • Measurements for different PMT HV 610 V 730 V