1 / 36

Hubway Data Visualization Challenge: Spotfire

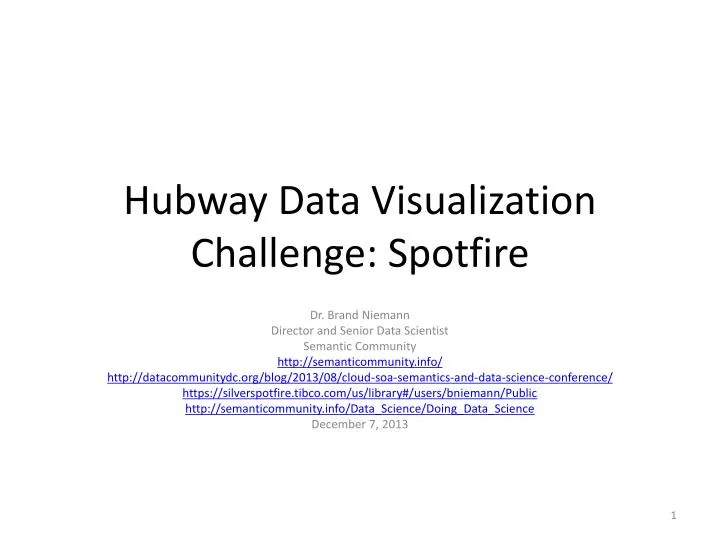
Hubway Data Visualization Challenge: Spotfire. Dr. Brand Niemann Director and Senior Data Scientist Semantic Community http://semanticommunity.info/ http://datacommunitydc.org/blog/2013/08/cloud-soa-semantics-and-data-science-conference/

fadhila
Download Presentation

Hubway Data Visualization Challenge: Spotfire

An Image/Link below is provided (as is) to download presentation Download Policy: Content on the Website is provided to you AS IS for your information and personal use and may not be sold / licensed / shared on other websites without getting consent from its author. Content is provided to you AS IS for your information and personal use only. Download presentation by click this link. While downloading, if for some reason you are not able to download a presentation, the publisher may have deleted the file from their server. During download, if you can't get a presentation, the file might be deleted by the publisher.

E N D

Presentation Transcript


  1. Hubway Data Visualization Challenge: Spotfire Dr. Brand Niemann Director and Senior Data Scientist Semantic Community http://semanticommunity.info/ http://datacommunitydc.org/blog/2013/08/cloud-soa-semantics-and-data-science-conference/ https://silverspotfire.tibco.com/us/library#/users/bniemann/Public http://semanticommunity.info/Data_Science/Doing_Data_Science December 7, 2013

  2. Explanation • Discovered the Hubway Data Visualization Challenge while preparing my lectures for teaching a Practical Data Science for Data Scientists class using the new book Doing Data Science. • Every time a Hubway user checks a bike out from a station, the system records basic information about the trip. See if you can answer questions from the data. • Decided to take the challenge even though it was over by building a dynamic Knowledge Base instead of the Hubway Seeking Metro-Boston static figure. • See 67 entries and how to submit@hubwaydatachallenge.org • Built a Knowledge Base in a spreadsheet (33 data sets) and Spotfire (27 tabs). • I used the CSV files and Shapefile (10MB ZIP), the aggregated rebalancing data sample, and the related data (Census, neighborhoods, bike facilities, elevation, etc.) packaged up as Hack Day Treat (100MB ZIP).

  3. Hubway Data Visualization Challenge http://hubwaydatachallenge.org/

  4. Hubway Seeking Metro-Boston Figure 9-17. This is a visualization by Eurry Kim and Kaz Sakamoto of the Hubway shared-bike program

  5. Knowledge Base: Spreadsheet http://semanticommunity.info/@api/deki/files/27392/DoingDataScience.xlsx

  6. Knowledge Base: Spotfire

  7. Exploratory Data Analysis:Metadata

  8. Exploratory Data Analysis:Trips

  9. Exploratory Data Analysis:Trips Filter by Registered

  10. Exploratory Data Analysis:Trips Filter by Casual

  11. Exploratory Data Analysis:Trips Filter by Female

  12. Exploratory Data Analysis:Trips Filter by Male

  13. Exploratory Data Analysis:Stations 1

  14. Exploratory Data Analysis:Stations 2

  15. Exploratory Data Analysis:Station Capacity

  16. Exploratory Data Analysis:Rebalancing

  17. Exploratory Data Analysis:Census 2010 Blocks

  18. Exploratory Data Analysis:Somerville Neighborhoods

  19. Exploratory Data Analysis:Open Space Polygons

  20. Exploratory Data Analysis:MBTA Stations

  21. Exploratory Data Analysis:MBTA Lines

  22. Exploratory Data Analysis:Library Points

  23. Exploratory Data Analysis:InfoGroup Employers

  24. Exploratory Data Analysis:Hydro 25k Polygons

  25. Exploratory Data Analysis:Farmers Markets

  26. Exploratory Data Analysis:EOT Roads

  27. Exploratory Data Analysis:Colleges

  28. Exploratory Data Analysis:Cambridge Neighborhoods

  29. Exploratory Data Analysis:Boston Neighborhoods

  30. Exploratory Data Analysis:2009-2010 Crashes

  31. Exploratory Data Analysis:VMT 250m Grid

  32. Exploratory Data Analysis:Hubway Municipalities

  33. Exploratory Data Analysis:Travel Time to Work

  34. Exploratory Data Analysis:Race Ethnicity

  35. Exploratory Data Analysis:Population by Gender and Age

  36. Exploratory Data Analysis:Median Household Income

More Related