Download
1 / 23
230 likes | 367 Views
LPROT Experiment. TE/MPE/PE EN/STI EN/MME. Objectives. Create the conditions to produce hydrodynamic tunneling . Benchmarking FLUKA-BIG2 simulations . Assert the damage potential of high-intensity high dense- beams . Concept.

E N D
LPROT Experiment TE/MPE/PE EN/STI EN/MME
Objectives • Createtheconditionsto produce hydrodynamictunneling. • Benchmarking FLUKA-BIG2 simulations. • Assertthedamagepotential of high-intensityhigh dense-beams.
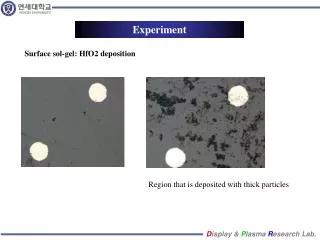
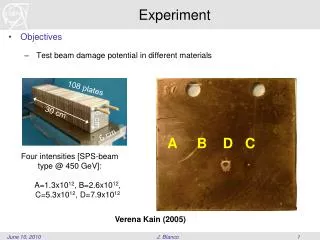
Concept • Irradiate a High-Z material with a high intensity high brightness beam • Study the damage on the material after the irradiation • Try to observe the tunneling effect on the target while it occurs
Layout of Experimental Area Largetest object Smalltest objects • Flexible optics to provide beam radii of s = 0.1 to 2.0 mm at the focal points. • Focal point longitudinal location continuously variable between positions 1 and 3. • Predefined optics for 3 focal points and 6 beam sizes. BTV
Phase I.a. (22nd June, 2nd,3rd July), Beam summary • 71 low intensity single bunch shots (2E9-1E10 p+) • 85 high intensity single bunch shots (1E11-2E11 p+)
Phase I.b. (6th July), Beam summary • 8 high intensity multi-bunch shots (1.5E11 p+)
Phase II (12-July-2012) • Target 1: 144 bunches ~1.9E11 @ 50ns, 2mm sigma beam (no tunneling expected) -> reference shot • Target 2: 108bunches ~1.9E11 @ 50ns, 0.2mm sigma beam -> tunneling expected • Target 3: 144 bunches ~1.9E11 @ 50ns, 0.2mm sigma beam -> tunneling expected
Expected signal • For target 1, large beam size, no tunnelling • Constant signal with time on all diamond • For target 2 and 3, small beam size, tunnelling • Diamond 1 signal: decreases • Diamond 2 signal: decreases • Diamond 3 signal: increases
Target 1 Diamond 1 Diamond 2 Diamond detectors raw signals Diamond 3 Expectedconstantsignal -> no tunneling Signaldropsdueto a decrease in thebiasvoltage. Thevoltagedecreaseiscausedbythedischarge of the HV capacitors.
Data correction • For target 1: • Calculate the ΔV for each bunch. • Ratio between signal bunch(x)/bunch(3) • Ration between FWHM bunch(x)/bunch(3) • For target 2 and 3: • Calculate the ΔV for each bunch. • Look the correction coefficient from calibration in target 1. • Look for the FWHM correction from calibration in target 1.
Corrected signalsfor target 3 (144 bunches, 50ns, 0.2 mm sigma)
-16.3% 5.7% 15.8%
10.8% 2.7% 17%
Results • Diamond 1 and 3 signal move in the expected direction • Diamond 2 signal slight increasehowever expected to decrease (from simulation for 0.1mm) • Over-correcting: unconsidered effects • Large difference from simulations
Results • Compare target 3 and target 2 • Different geometry -> affects d2 & d3 • Target 2 should have less difference in % from T1 Ok, less affected by geometry Not OK
Better correction • Calibration experiment: 1. Calculate the diamond signal (Q) vs bias voltage • For target 2 and 3: • Calculate the ΔV for each bunch. • Look the correction coefficient from calibration experiment (Q/Q0).
Another calibration experiment • Alignment for HiRadMat crystal collimator experiment • Profit from experiment -> calibrate diamond detector signal against simulations • Symmetrical geometry provides a ratio between diamond signals
Upcoming (november) • Open the target and visually inspect it. • Measure activation profile on the targets • If activation is acceptable, take some samples to a lab and perform: Xraysor Ultrasounds. • Compare diamond signal with simulations and with samples
Conclusions • Firsthydrodynamicexperimentwith a high-intense high-dense beam • Experimentwas a success -> evidence of tunneling • In detailanalysisof thesamplesneededtopreciselyevaluatepenetrationlength • SuccessfulDiamonddesignand implementation