Download
1 / 34
340 likes | 609 Views
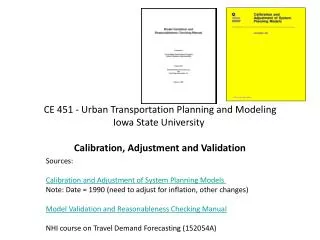
CE 451 - Urban Transportation Planning and Management Iowa State University Calibration and Adjustment Techniques, Part 2. Source: Calibration and Adjustment of System Planning Models. 5.0 Trip Distribution 5.1 Mean Trip Length - recall: shape of curve affects trip length distribution

E N D
CE 451 - Urban Transportation Planning and ManagementIowa State University Calibration and Adjustment Techniques, Part 2 Source: Calibration and Adjustment of System Planning Models
5.0 Trip Distribution • 5.1 Mean Trip Length • - recall: shape of curve affects trip length distribution • See below for effect of changing friction factors
varying trip length has a big impact on assigned volumes • portions of a friction factor table can be adjusted (more flexible than adjusting equations)
5.2 Estimate Trip Length • compare average trip lengths (in minutes) by purpose to: • HBW t = 0.98 x p.19 • HBSR t = 2.18 x p.12 • HBSh t = 8.1 • NHB t = 0.63 x p.20 • where p is population • SR = social/recreation • Sh = shopping
From Minimum Travel Demand Model Calibration and Validation Guidelines for the State of TN
Source: Virginia Travel Demand Modeling Policies and Procedures Manual
Source: Virginia Travel Demand Modeling Policies and Procedures Manual
Source: Virginia Travel Demand Modeling Policies and Procedures Manual
5.3 Employment Distribution Problems (large cities, mostly) problem: match low income households with low income jobs solution #1: disaggregate trip purposes by income quartile solution #2: use k-factors (trial and error) … yuk Jobs/Housing Imbalance!
5.4 Special Treatment, other trip purposes • - schools (ignore if small %?) • - trucks (calibrate with externals?) • Taxi • normally, distortions are insignificant
6.0 Traffic assignment 6.1 All or nothing - adjusting link speeds will change assigned volumes - initial speeds should be set to LOS C speeds (0.87 x free flow speeds)
6.2 capacity restraint - volume = f(time) - final volume is average of all iterations or later iterations can be weighted more heavily - adjust free flow time or c (capacity) to change volumes IF… THEN… Link Speed Travel Assigned Capacity Time Volume
6.2.1 definition of capacity design: LOS C (0.87c) ultimate: LOS E (1.00c) parameters differ depending on definition of capacity … if defined as LOS C, 0.15(v/c)4 if defined as LOS E, 0.80(v/c)4 (see HCM)
6.3 equilibrium - multiple paths may be selected 6.3.2 free speeds in systems with good progression should be coded at about 1.1 times the speed limit time - more than 10 iterations may be needed for small areas
7.0 Transit Ridership - for small/medium cities, may not have to build a transit network - If not using a transit network, can use the following method (if trip generation includes transit trips): 1. increase auto occupancy by transit percentage (e.g. if auto occupancy is 1.05, then change to 1.05 x 1.38 = 1.45) if transit percentage is 38% 2. decrease trip production or attraction rates (one of them only, then balance) … if you use productions, can vary mode split by income class 3. modify productions or attractions by zone - get data from transit company - adjust socioeconomic data or make direct P/A adjustments
8. External stations • - externals have no socioeconomic data • - Ps and As are prepared by matching ground counts • - I/E treated with the gravity model • E/E • - compare with Table 11 below
System vs. local checks • check 1. system wide (screenlines) • 2. major movements (cutlines) • 3. links • if all screenlines are high or low, vary • - auto occupancy • - trip generation rates • - trip lengths • - intrazonal times - all zones • - socioeconomic data - all zones if corridor volumes are high or low, vary (for zones affecting corridor…) - auto occupancy - trip generation rates - intrazonal travel times - land use - centroid connectors - intersection penalties if links are high/low, vary - speed - intersection penalty - centroid locations - special generators - local network configuration
10. Expected/Required accuracy • We are concerned about errors that would require a design change (e.g. number of lanes) • Note that ground counts also contain error • Perfectly calibrated models produce link estimates with 1/3 above the standard error in ground counts and 2/3 below the standard error. • Need ground counts for 65% of freeways and arterials, and a good sample from other facilities From Minimum Travel Demand Model Calibration and Validation Guidelines for the State of TN
10. Expected/Required accuracy (cont.) • The correlation coefficient should be greater than .88 • VMT estimate (region-wide) should be within 5% (take care to compare same roads in systems) • VMT/person should be 17-24 for large areas, 10-16 for smaller areas (see also Table A7, next page) • VMT/household should be 40-60 for large areas, 30-40 for smaller areas
From Minimum Travel Demand Model Calibration and Validation Guidelines for the State of TN
Source: Virginia Travel Demand Modeling Policies and Procedures Manual
From Minimum Travel Demand Model Calibration and Validation Guidelines for the State of TN
From Minimum Travel Demand Model Calibration and Validation Guidelines for the State of TN
Source: Virginia Travel Demand Modeling Policies and Procedures Manual
From Minimum Travel Demand Model Calibration and Validation Guidelines for the State of TN