Download
1 / 33
330 likes | 458 Views
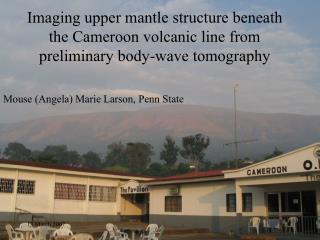
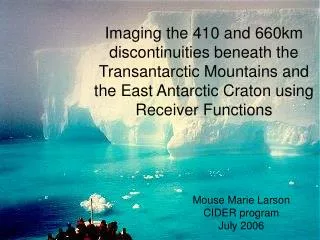
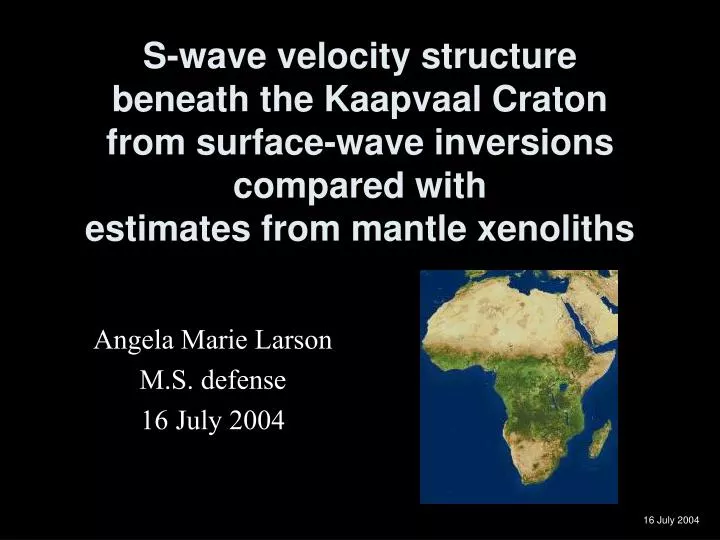
S-wave velocity structure beneath the Kaapvaal Craton from surface-wave inversions compared with estimates from mantle xenoliths. Angela Marie Larson M.S. defense 16 July 2004. Acknowledgments.

E N D
S-wave velocity structure beneath the Kaapvaal Craton from surface-wave inversions compared with estimates from mantle xenoliths Angela Marie Larson M.S. defense 16 July 2004
Acknowledgments I would like to thank my advisor, Arthur Snoke, as well as my committee members, David James and Martin Chapman Thanks also go to the VT Geosciences Dept for their support as well as the Aubrey E. Orange Award I think an eternal debt is owed to Connie and Richard for always making things go a little more smoothly Thanks to all of my friends and associates in the dept A special thank you goes to Brian, Laura O, and my animal family for your support (I know I can be hard to deal with…)
This presentation compares two methods for calculating the S-wave velocity structure of the Kaapvaal Craton Why? The purpose behind the study Where and Who? Study area and previous work How? Xenoliths, surface waves, inversions Oh my! What? Conclusions
The purpose of this research is to: Calculate the S-wave velocity structure of the Kaapvaal Craton using surface waves Compare xenolith analysis and surface-wave analysis for the upper-mantle velocity structure Look for the existence of a low-velocity zone beneath the Archean craton using synthetics This slide is for Maddy!
The region contains almost 1 Ga of Archean history and has remained largely unaltered since its formation Political boundaries Geologic provinces
The Southern African Seismic Experiment collected seismic data in a dense (1º spacing) array There were 79 stations deployed for a minimum of 1 year
The Kaapvaal Project researchers also performed geochemical/petrologic studies on local xenoliths Approximately 100 on-craton samples with ages ~90 Ma were analyzed geothermobarometrically
Kimberlite pipes are for more than just diamonds; some can be analyzed for their records of mantle properties http://www.amnh.org/exhibitions/diamonds/ The procedure ofanalyzing mantle xenoliths for upper mantle seismic structure has not been utilized much…yet
The Kaapvaal xenoliths provide a snapshot of seismic velocities and density for the craton at ~90 Ma The xenoliths studied were emplaced in the southern half of the craton
The xenolith results indicate a slight decreasing trend in S-wave velocities for the applicable depth range The xenoliths reflect seismic velocities and density for a depth range of 50 to 180 km.
The surface-wave data is selected by choosing well-recorded earthquakes The earthquake must be large enough to record in the array with a reasonable signal-to-noise ratio Favorable earthquakes had epicenters with great-circle paths passing through the NE and SW quadrants of the array These earthquakes must cross continent-ocean boundaries and mid-ocean ridges (if applicable) at near-normal incidence
Five events were used for study There were four events near the coast of central Chile and one in Iran. Their great-circle paths to the center of the array are shown
Frequency-time analysis helps with the selection of a range of useful periods and frequencies A range for this event would be 3.40 - 4.05 km/s and about 25 - 180 seconds
Station pairs have their own selection criteria At least 200 km between stations No more than 3º difference in backazimuths Well-recorded at both stations
The Bushveld Complex appears to affect the velocity structures of the Kaapvaal Craton To work with “pure” craton, I excluded all station pairs with interstation paths within the Bushveld
I found 16 paths from the five events using the selection criteria Several events use the same station pair and some events use collinear paths
“The velocity with which an observable, individual wave or wave crest is propagated through a medium” The phase velocities are calculated for many (or all) of the periods over a range to make a dispersion curve
A dispersion curve was calculated for each of the 16 different event/paths The solid line on the left is the dispersion curve calculated from the xenolith-based model
The 16 sets were combined into a single composite curve and compared with the xenolith-based curve The curve fits the data very well, and this is a pre-inversion result
The Neighbourhood Algorithm (NA) is used to find an ensemble of models that fit a chosen misfit criterion The NA is a non-linear direct search method. The search results are not limited to a single maximum
The misfit criterion was essentially a standard deviation with the potential for a penalty to be assessed The penalty is designed to cause physically-unlikely models to be thrown out
There were eight non-independent parameters arranged over the depth range for the model All solution models were constrained to match the reference model values for velocities greater then 400 km
After 10,000 model iterations, 1,788 models fit within the misfit cutoff of 0.015 This selected misfit allowed for enough potential models that their dispersion curves visually filled the space of the error bars
Between the “best” model and an “average” model, I chose the average model The best model had the smallest overall misfit, but it is a physically less likely model
To test for uniqueness, I compared the xenolith-based results with those from different reference models These global models are not plausible for continental shields. The dispersion curves produced from the unaltered models don’t fit
After inversions performed by the NA, models are found that have reasonable fits to the original seismic data The gentle reverse “s”-curves are a result of the fewer parameters of NA and from using reference models that were so unlikely
The results are that the xenolith-derived results match the seismic-derived S-wave velocity model The region of most interest is from 50 to 180 km depth
I ran synthetic tests to check for evidence of a low-velocity zone (LVZ) The SYNTH model was made by perturbing the XNLTH model; a LVZ was put in starting at 180 km depth.
An NA inversion run produced acceptable models that fit the SYNTH generated dispersion velocities There is no LVZ starting at 180 km depth --- the models are significantly different
In summary The xenolith analysis and surface-wave analysis agree for the upper-mantle velocity structure This means that the geotherm of the Kaapvaal Craton is almost the same today as it was 90 Ma
And There is no LVZ starting at 180 km depth or less beneath the Kaapvaal craton Therefore, either there is a significant tectonic root and the LVZ is deeper than 180 km or low velocities and low viscosities are not closely correlated
Conclusions: The xenolith analysis and surface-wave analysis agree for the upper-mantle velocity structure Mischief managed! and There is no LVZ starting at 180 km depth or less beneath the Kaapvaal craton Questions?