Download
1 / 58
590 likes | 695 Views
Coalition of Communities of Color. Presentation to Multnomah County Board of Commissioners March 16, 2010. Overview. Brief recap of this project & the Coalition Synthesis of findings Population counts Selected findings on disparities Community-specific findings Asian/Pacific Islander

E N D
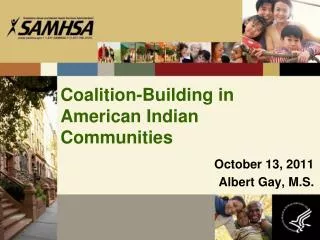
Coalition of Communities of Color Presentation to Multnomah County Board of Commissioners March 16, 2010
Overview • Brief recap of this project & the Coalition • Synthesis of findings • Population counts • Selected findings on disparities • Community-specific findings • Asian/Pacific Islander • Slavic • African Immigrant & Refugee • African American • Hispanic • Native American • Recommendations • Next Steps
Coalition of Communities of Color The Coalition’s mission is: • To address the socioeconomic disparities, institutional racism, and inequity of services experienced by our families, children and communities • To organize our communities for collective action resulting in social change to obtain self-determination, wellness, justice and prosperity
Coalition of Communities of Color • Formed in 2001 • Membership • Culturally-specific community based organizations • Representative members include El Programa Hispano, Urban League of Portland, Native American Youth and Family Center, Asian Family Center, Africa House, and Slavic Coalition of Oregon • Principles • Self-determination • Equity • Direct Contracts • Core Services for ALL • Relationships
A quick recap of this project • Partnership between PSU’s School of Social Work & the Coalition of Communities of Color • Funding from: • Multnomah County ($100,000 for one year, FY09) • City of Portland ($50,000 for one year, 2009) • Northwest Health Foundation ($180,000 spread over three years, 2009-2011) • Coalition of Communities of Color (In-kind contribution of $36,000/year) • Portland State University (In-kind research contribution of $27,800 in FY09 & through 2011, and grant of $9,400 for 2010)
Recap (cont’d) • First presentation to Multnomah County Commissioners was March 19, 2009 • Presented initial findings • Dialogue about Census 2010 • We got very involved in Census 2010 with most organizations very involved in increasing response rates and helping bring more funding to the County • Many of us have joined you at the Complete Count Committee • Today • Updated and expanded data • Recommendations • Clear next steps
Synthesis of our work • We are sizeable and growing in numbers • We are rendered less visible by undercounts that we are solving in several ways • There are huge disparities across all systems and institutions between Communities of Color and Whites • It is worse here than in King County (home to Seattle) for communities of color • It is worse here for communities of color than USA averages • These disparities are worsening over time • These comparisons show that policy can influence outcomes • The policy landscape is failing our communities • We can and must reverse these trends
Communities of color in Multnomah County • Communities of color make up a significant portion of Multnomah County’s population ….
Our communities are young… • We make up 45.0% of local public school students • And this portion is growing quickly
How many are we? Several ways to “count” • Very important issue since tied to visibility, status, funding and power • American Community Survey, 2008 • “Alone” figures • “Alone or in combination” (AOIC) with other races • “Alone or in combination, with or without Hispanic” • Census 2010 • We have been active here to increase turnout • Two of our communities will be invisible (only short form administered) • African Immigrant & Refugee • Slavic
We do know that this results in an “overcount” of 7.7% as per conventional numbers, but…
We dispute these “official” counts • Undercounting legacy, due to: • Whiteness bias in conventional surveys • Forms inadequate to capture lived experience & identity • Unwillingness to fill out forms • History of genocide, persecution & fear • Distrust of governments • Have acculturated to deny one’s identity – desiring whiteness is commonplace • Lack of inclusion • English capacity as 5.1% of the county population cannot communicate in either English or Spanish • Poverty-related causes (eg. moving, phones)
ACS shortcomings • ACS is flawed in accurately counting our communities • Due to the reasons on the prior page • Comparison with ODE records that shows errors in accuracy • Our examination of ACS data & comparison with ODE data shows an ACS undercount of 4.8%, and a miscoding that undercounts about 15% of youth of color • This is first “hard” evidence that ACS is flawed
Results of Undercounting • Invisibility & tokenistic responses to needs • Financial • Estimated by Census Bureau that each person undercounted in Census 2010 results in $300/year in funding for the region • Political • Census numbers determine appointments of seats in the House, and for drawing Congressional districts within the states & local governments • Research • Census figures serve to set standards for “inclusion” and “representativeness” in research, so undercounting weakens all research (though few researchers are aware of this)
Community-Verified Counting Method • Our own community-verified counts (informed by research & critique of dominant methods) • Native American: Has collected data on tribal registry numbers • Latino: Using secondary research on the number of undocumented people, and the proportion who do not complete Census/ACS forms • Asian/Pacific Islander: Comparing Census counts for smaller communities with local network estimates of, for example, the Hmong and Burmese residents • Similar approach with African Immigrants & Refugees • A post-Census 2010 survey of those who did not complete the form could shed light on this issue
Our position • Use the “Alone or in combination with or without Hispanic” numbers for determining the size of our communities (as immediate response), and use these numbers from 2008 ACS until the next round of data is released • When finalized, use the community-verified counts
How are we doing? • “Communities of color in Multnomah County: An unsettling profile” (March 2010) • The first of a series of seven research reports • Remaining six reports to address community-specific issues • Disparities exist across all institutions addressed in the report. The magnitude of these disparities is alarming. Consider some of these data…
Communities of color earn half the incomes of Whites, earning $16,636 per year, while White people earn $33,095 annually. • Disparities close to this magnitude exist regardless of one’s family and household configuration • Commissioners saw a similar chart last year. These data are updated and they have worsened.
Poverty levels among our communities are at levels at least double those of Whites. • Our child poverty rate, collectively, is 33.3%, while that of White children is 12.5%.
Schooling & the Achievement Gap • Educational disparities in our local public schools are deeply entrenched; gains made earlier in the decade have been lost, and the achievement gap is widening.
Preschool Disparities • By the time children enter kindergarten, there is a disparity that, depending on the measure, averages between 5% and 15% in “readiness for learning” scores • Discipline disparities • Students of color fare much worse than Whites in major suspensions & expulsions • Dropout rates • Students of color drop out of school (or are “pushed out”) much more frequently than Whites • While only 7% of Whites do not graduate high school, 30% of communities of color do not
The labor market is ripe with disparities. Communities of color access management and professional positions at half the levels of Whites. • One of every two Whites access such high status and high paid work, while less than one of every four people of color access these positions.
Additional Disparities • Unemployment • Communities of color have unemployment rates that are 35.7% higher than Whites • Hiring in public service • County: 21.0% of employees are people of color while 26.3% would suggest no employment barriers exist • City: 16.6% of employees of color when 26.2% would be parity • County contracts • Minority-owned businesses were 12 of 120 contracts. While this is an increase over the prior year, there was a drop in the value of these awards. Minority businesses lost over 20% of their claim on County contracts, dropping from 4.9% of the amounts awarded to 4.0%
Health disparities, while unevenly distributed across communities of color, average out to result in significant disproportionality. Low birth weights among communities of color are 37% worse than for Whites. • The child welfare system disproportionately removed children of color from each community at some point in the child welfare process. • African American and Native American children are grossly overrepresented foster care. Once in care, African American and Native American children are likely to stay in care longer than other children.
Communities of Color in Multnomah County: An unsettling profile • Communities of color suffer more than the national levels for similar communities of color…..
In the measures explored in this report (incomes, poverty, occupation and education), communities of color have between 15% and 20% worse outcomes. It is more difficult to get ahead here in Multnomah County than it is more generally across the USA. • This inequity does not hold true for White people. On average, one’s income is enhanced by living in Multnomah County.
Communities of Color in Multnomah County: An unsettling profile • How have communities of color here fared in comparison to those in a western nearby city? • In comparison with King County (home to Seattle), we have worse disparities and worse outcomes on every measure examined….
Communities of Color in Multnomah County: An unsettling profile • Are local conditions improving or deteriorating for communities of color? Looking at this in two ways, we found… • Intergenerational income research • Comparing incomes of Whites and communities of color showscommunities of color have not fared well • Changes between 2007 to 2008 on 26 measures • 16 measures are worse • 6 are better • 4 stayed the same
Only the wealthiest 40% of Whites have gained significant ground over the last generation (at an average of $47,663/year) while that same grouping among people of color have lost income (facing an average loss of $1,496 per year).
Across 26 measures… • The crucial measures of incomes, obtaining a university degree, all poverty measures and health insurance had all deteriorated.
Across 26 measures.... • Two of the positive gains in housing and unemployment were due not to an improved situation for communities of color, but due to a more rapidly deteriorating situation for White people which narrowed disparities.
The Asian/Pacific Islander Experience • We have learned an important lesson about our Asian/Pacific Islander communities. • Asian/Pacific Islander communities typically fare well in national studies, often outperforming Whites on measures such as incomes, occupations, education, poverty and housing. • This does not occur in Multnomah County. • Here, the characteristics of the Asian/Pacific Islander community much more closely resemble those of other communities of color than they do of Whites.
The Slavic Experience • First time any specific data on this community is available • Education is very high with 39.3% having a university degree • Almost ¼ of Slavics have a graduate degree while Whites have only 15.7% at this level • Yet those who do not graduate high school are high, outnumbering by 2:1 those Whites who don’t graduate high school • Incomes are less than Whites, sometimes much worse • Poverty – in every measure, have worse poverty rates than Whites • This very highly educated community is unable to protect itself from poverty & unemployment at the levels of Whites • This suggests they face significant employment barriers as a result of their identity
The African Immigrant & Refugee Experience • First time any specific data on this community is available • Education • Again, very high levels with ¼ having a graduate degree • Poverty levels 3- to 4-fold higher than Whites • Across the African community, poverty is deep • For the African immigrant and refugee community, the child poverty rate is 56.4%
The African American Experience • The State of Black Oregon explored the state-wide experience. We look at the county-level data…
The African American Experience (cont’d) • Child poverty • At a rate of 40.9% (instead of 12.5% for Whites) • Juvenile justice • Are 5½ times more likely to get referred into the justice system (instead of warnings and diversion)
The Hispanic Experience • Education • 44.4% of our community did not graduate high school (compared with 7.6% for Whites) • Despite being 10.8% of the Multnomah county’s population, we graduate from OUS post-secondary institutions at just 4.2% of degrees awarded • We have lost ground in graduating our youth from PSU and OHSU in the last 8 years • Incomes • Our individual incomes are close to 1/3 those of Whites
The Native American Experience • Disastrous poverty rates • Child poverty rate of 45.7% • 100% of female-led mothers raising children under 5 live in poverty • Rapidly shrinking incomes • Those earning below average incomes… • Poverty, unemployment, dropout rates, incomes, occupation have significant disparities • And it’s worse here than elsewhere in the USA…
Communities of Color in Multnomah County: An unsettling profile “The failings of mainstream institutions to address the needs of communities of color are abundant and must create the impetus to act, to act holistically, and to act under the leadership of communities of color who have the legitimacy and the urgency to remedy many of the shortcomings that besiege Multnomah county.”
Affirming… Affirm culturally-specific funding. • We affirm and appreciate Multnomah County’s dedicated funding pool within the DHS, SUN Service System and seek to expand this commitment, urging all funding units in all levels of government to make such allocations a priority. Support equity initiatives at County-level. • The Equity Council, the Undoing Institutional Racism and the Health Equity Initiative efforts hold promise to reduce disparities.
Recommendations • We make the following recommendations for addressing the needs of communities of color…
Recommendations 1. Expand funding for culturally-specific services. • These must expand. Designated funds are required. Allocation must recognize the size of communities of color, must compensate for the undercounts that exist in population estimates, and must be sufficiently robust to address the complexity of need that are tied to communities of color.
Recommendations 2. Implement need-based funding for communities of color. • We urge funding bodies to begin implementing a needs-based funding allocation that seeks to ameliorate some of the challenges that exist in resourcing communities of color. 3. Emphasize poverty reduction strategies. • Poverty reduction must be an integral element of meeting the needs of communities of color. A dialogue is needed immediately to kick-start economic development efforts that hold the needs of communities of color high in policy implementation.