Download
1 / 44
440 likes | 609 Views
Ph. D. Dissertation defense Evaluation of the Performance of the MODIS LAI and FPAR Algorithm with Multiresolution Satellite Data Yuhong Tian Department of Geography, Boston University Dissertation Committee Ranga B. Myneni Yuri Knyazikhin Mark A. Friedl Curtis E. Woodcock

E N D
Ph. D. Dissertation defense Evaluation of the Performance of the MODIS LAI and FPAR Algorithm with Multiresolution Satellite Data Yuhong Tian Department of Geography, Boston University Dissertation Committee Ranga B. Myneni Yuri Knyazikhin Mark A. Friedl Curtis E. Woodcock Alexander L. Marshak 1 of 39
Contents 1. Introduction 2. Objectives 3. Research Topics • Prototyping of the MODIS LAI/FPAR algorithm with LASUR and Landsat data • Radiative transfer based scaling of LAI/FPAR retrievals from reflectance data of different resolutions • Multiscale analysis and validation of the MODIS LAI over Maun, Botswana 4. Concluding Remarks 5. Future Work 2 of 39
1. Introduction • LAI and FPAR: • Definition • LAI: green leaf area index, one-sided green leaf area per unit • ground area. • FPAR: fraction of photosynthetically active radiation (0.4- • 0.7 m) absorbed by the vegetation. • Importance • They are key variables in land surface models for calculation of surface photosynthesis, evapotranspiration, and net primary production. 3 of 39
2. Objectives • Prototyping: • To test the physical functionality and performance of the algorithm with MODIS like data. • Effects of spatial resolution: • To inquire about the cause of the discrepancy between coarse and moderate resolution output from the same algorithm. • To investigate the adjustment of retrieval techniques for data resolution. • Validation: • To derive uncertainty information on LAI/FPAR product by comparing with field data. • To define a sampling strategy. 4 of 39
3. Research Topics Part One Prototyping of the MODIS LAI/FPAR Algorithm with LASUR and Landsat data Tian et al., “Prototyping of MODIS LAI and FPAR algorithm with LASUR and Landsat data”. IEEE Trans. Geosci. Remote Sens. 38(5):2387-2401, 2000. 5 of 39
Research Topics: Part one Introduction Prototyping: use data from other instruments to test the functionality of the MODIS algorithm before MODIS data are available. 6 of 39
Research Topics: Part one • Data • Land surface reflectances (LASUR). - spatial resolution: 1/7th of a degree - RED (572-698 nm) and NIR (716-985 nm) from July 1989 • A TM image of Northwest U.S. (Washington and Oregon). -30 m resolution - RED (630-690 nm) and NIR (760-900 nm) from June 26, 1987. • A biome classification map (BCM). - Grasses and cereal crops - Shrubs - Broadleaf crops - Savannas - Broadleaf forests - Needle forests 7 of 39
Research Topics: Part one Consistent with Physics 8 of 39
Research Topics: Part one Impact of Biome Misclassification 9 of 39
Research Topics: Part one Scale Dependence of the Algorithm LANDSAT Fine resolution LASUR Coarse resolution 10 of 39
Research Topics: Part one • Conclusions • Prototyping results demonstrate the ability of the algorithm to produce global LAI and FPAR fields. • The LAI and FPAR fields follow regularities expected from physics. • The algorithm is dependent on the spatial resolution of the data. 11 of 39
Research Topics Part Two Radiative transfer based scaling of LAI/FPAR retrievals from reflectance data of different resolutions Tian, et al., “Radiative transfer based scaling of LAI/FPAR retrievals from reflectance data of different resolutions”. Remote Sens. Environ., 2001 (in review). 12 of 39
Research Topics: Part two Introduction • Scaling issues arise when • one attempts to assemble a consistent time series of LAI/FPAR products with data from different spatial resolutions. • one attempts to validate moderate resolution (~ 1 km) sensor products with field measurements at much finer resolutions. The goal of scaling: values of LAI derived from coarse resolution sensor data should equal the arithmetic average of values derived independently from fine resolution sensor data. 13 of 39
Research Topics: Part two • Objectives • To investigate the effect of pixel heterogeneity on LAI/FPAR retrievals. • To develop a physically based theory for scaling with scale dependent radiative transfer formulation. 14 of 39
Research Topics: Part two • Data • AVHRR land surface reflectances at 1 km resolution over North America for July 1995 • - RED (580-680 nm) and NIR (725-1100 nm). • - 1 km AVHRR reflectance data were aggregated to 4, 8, 16, 32 and 64 km • resolutions. • A six biome map of North America - developed from 1 km AVHRR NDVI data of 1995 and 1996 by Lotsch et al. (2000). 15 of 39
Research Topics: Part two Characterizing Land Cover Heterogeneity A 4 km x 4 km resolution pixel • Percentage function (pf). The percentage occupation of subpixel biome type in a given coarse resolution pixel. • “purity” of a pixel. pf1=3/16; pf4=4/16; pf5=9/16 Purity of this pixel=pf5=9/16 Percentage function of dominant biome type in a given coarse resolution pixel. 16 of 39
Research Topics: Part two Purity Decreases as Spatial Resolution Decreases Biome purity > 90% Biome purity < 50% Percentage of pixels Percentage of pixels Resolution (km) Resolution (km) 17 of 39
Dominant Land Cover Purity Research Topics: Part two Purity Has a Strong Effect on LAI Retrievals Input: • Reflectance at 4 km resolution • Biome type Error = |LAItrue-LAIestimated|/LAItrue 18 of 39
Research Topics: Part two Energy conservation law as a tool to scale models N Ni=Noi +pNoi+ (p)2Noi+… = Noi/(1-p) (1-p)N0i Noi Leaf absorption: (1-)Noi Leaf scattering:Noi Leaf interception:pNoi Nt= Not/(1-pt) N = NR + Nt + (1-)Noi Not = 1/(1-pfsoil)jpfj : leaf albedo, the portion of radiation flux density incident on the leaf surface that the leaf transmits and reflects. p: the fraction of photons that are scattered by leaves and will interact with leaves again. 19 of 39
Dominant Land Cover Purity Dominant Land Cover Purity Research Topics: Part two Improved Retrieval Accuracy Before After 20 of 39
Research Topics: Part two • Conclusions • LAI retrieval errors are inversely related to the proportion of the dominant land cover in a coarse resolution pixel. • Pixel heterogeneity must be accounted to improve accuracy in retrievals. 21 of 39
Research Topics Part Three Multiscale analysis and validation of the MODIS LAI over Maun, Botswana Tian, et al., “Multiscale analysis and validation of the MODIS LAI over Maun, Botswana”. Remote Sens. Environ., 2001 (submitted in October, 2001). 22 of 39
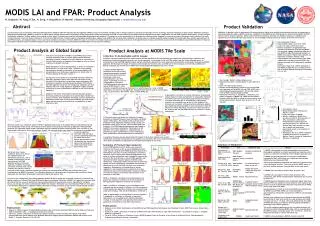
Research Topics: Part three Introduction As MODIS LAI and FPAR data start to become publicly available, product quality must be ensured by validation. Validation: the process of assessing the uncertainty of data products by comparison to reference data (e.g., in situ, aircraft, and high-resolution satellite sensor data). 23 of 39
Research Topics: Part three • Objectives • To develop an appropriate ground-based validation technique for assessing the uncertainties in MODIS LAI product. • To develop sampling strategies to collect data needed for validation of the MODIS LAI product. 24 of 39
Research Topics: Part three • Data • LAI measured by LAI-2000 Plant Canopy Analyzer. • Landsat ETM+ (30 m) data. • MODIS reflectance data (1 km) simulated from ETM+. 25 of 39
Pandamatenga S18 39.5 E 25 29.8 Maun S 19 55.8 E 23 30.7 Okwa S 22 24.6 E 21 42.8 Tshane S 24 10.1 E 21 53.3 Research Topics: Part three 26 of 39
1000 m 250 m 750 m 1000 m N375E 300 m N375W 0 25m A B C 250m N D E 250 m F 1 2 3 4 5 6 7 A375E A375W B375E B375W START POINT Research Topics: Part three Sampling Scheme 27 of 39
Field data ETM+ MODIS product Research Topics: Part three Validation of the MODIS LAI Product At Maun • Problems with validation • Only four pairs of pixels between field measurements and MODIS data. • Spatial registration is not accurate. 28 of 39
1 4 2 3 5 6 7 8 9 10 12 11 14 13 15 Research Topics: Part three Patch by Patch Comparison ETM+ Image Segmentation Map • Shortcomings of pixel by pixel comparison • GPS readings are not accurate. • Measured LAI values have high variation over short distances. 29 of 39
Research Topics: Part three Consistency between LAI Retrievals and Field Measurements LAI-Algorithm Retrievals s LAI-Field Measurements 30 of 39
Research Topics: Part three Underestimation of LAI for Coarse Resolution Data 31 of 39
Research Topics: Part three Hierarchical Analysis of Multiscale Variation in LAI Data Four scale levels: whole image > class > region > pixel D11 D1 D1=D11+ D12+D13 D2=D21+ D22 D3=D31+ D32+D33 D12 D21 D2 D13 D22 D33 D3 D31 D32 Four images: image effect, class effect, region effect, pixel effect 32 of 39
Research Topics: Part three Semivariogram Analysis for 4 Scale Levels sill Semivariance () range Distance (h) 33 of 39
Research Topics: Part three Three Sites Maun (Botswana) Harvard Forest (USA) Ruokolahti Forest (Finland) 34 of 39
Semivariance Semivariance Semivariance Research Topics: Part three LAISemivariograms Maun Harvard Forest Ruokolahti Forest Pixel Effect Region Effect Class Effect Original Image 35 of 39
Research Topics: Part three Conclusions • Consistency between LAI retrievals from 30 m ETM+ data and field measurements indicates satisfactory performance of the algorithm. • Hierarchical variance analysis shows that the LAI retrievals from ETM+ data demonstrate multiple characteristic scales of spatial variation. • Within the three sites, patterns of variance in the class, region, and pixel scale are different with respect to the importance of the three levels of landscape organization. • The spatial structure is small across the three sites. Validation needs to be performed over small areas. • For validation activities, patches are better than individual pixels unless sample and registration accuracy are outstanding. 36 of 39
4. Concluding Remarks • Prototyping results demonstrate the ability of the algorithm to produce global LAI and FPAR fields. The LAI and FPAR fields follow regularities expected from physics. • LAI retrieval errors are inversely related to the proportion of the dominant land cover in a coarse resolution pixel. • A physically based theory for scaling with a scale dependent radiative transfer formulation was developed. 37 of 39
Consistency between LAI retrievals from 30 m Landsat ETM+ data and field measurements from Maun (Botswana) indicates satisfactory performance of the algorithm. • LAI fields demonstrate multiple characteristic scales of spatial variation. Isolating the effects associated with different scales through variograms aids the development of a new sampling strategy for validation of MODIS products. 38 of 39
5. Future Work • Use MODIS products to improve representation of the land surface in global climate models using the scaling ideas developed here. 39 of 39
Frequency 1 2 3 4 5 LAI The MODIS LAI/FPAR algorithm • rk: modeled BRDF • dk:satellite measured BRDF • k: uncertainties in measurements and simulations • p=[canopy, soil] Solution distribution function
Research Topics: Part one Retrieval Index Depends on Quality of Surface Reflectance Uncertainty Retrieval Index: ratio of the number of retrieved pixels to total number of pixels.
Research Topics: Part three Image decomposition Xijk = I + Ci + Rij + Pijk I = (D) Ci = (Di) - (D) Rij = (Dij) - (Di) Pijk = Xijk - (Dij) I: the image effect; Ci: the effect associated with class i; Rij: the effect associated with region j of class i; Pijk: the pixel effect associated with pixel k of region j of class i.