Download

1 / 26
260 likes | 510 Views
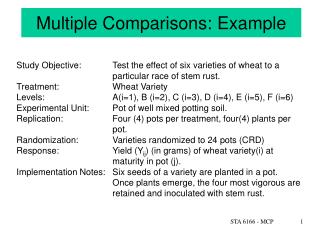
Spatial Smoothing and Multiple Comparisons Correction for Dummies. Ac knowledgements. Alexa Morcom, Matthew Brett. Spatial Smoothing and Multiple Comparisons Correction for Dummies (i.e., no equations). Ac knowledgements. Alexa Morcom, Matthew Brett. Overview. Spatial Smoothing

E N D
Spatial Smoothing andMultiple Comparisons Correction for Dummies Acknowledgements Alexa Morcom, Matthew Brett
Spatial Smoothing andMultiple Comparisons Correction for Dummies(i.e., no equations) Acknowledgements Alexa Morcom, Matthew Brett
Overview • Spatial Smoothing • What does it do? • How is it done? • Why do you want to do it? • Correction for Multiple Comparisons • Bonferroni correction • Random field theory • Uncorrected thresholds • False discovery rate • Which correction method to use?
Overview • Spatial Smoothing • What does it do? • How is it done? • Why do you want to do it? • Correction for Multiple Comparisons • Bonferroni correction • Random field theory • Uncorrected thresholds • False discovery rate • Which correction method to use?
Spatial Smoothing What does it do? • Reduces effect of high frequency variation in functional imaging data, “blurring sharp edges”
-5 0 5 Spatial Smoothing How is it done? • Typically in functional imaging, a Gaussian smoothing kernel is used • Shape similar to normal distribution bell curve • Width usually described using “full width at half maximum” (FWHM) measuree.g., for kernel at 10mm FWHM:
Spatial Smoothing How is it done? • Gaussian kernel defines shape of function used successively to calculate weighted average of each data point with respect to its neighbouring data points Raw data x Gaussian function = Smoothed data
Spatial Smoothing How is it done? • Gaussian kernel defines shape of function used successively to calculate weighted average of each data point with respect to its neighbouring data points Raw data x Gaussian function = Smoothed data
Spatial Smoothing Why do you want to do it? • Increases signal-to-noise ratio • Depends on relative size of smoothing kernel and effects to be detected • Matched filter theorem: smoothing kernel = expected signal • Practically, rule of thumb: FWHM ≥ 3 x voxel size • May consider varying kernel size if interested in different brain regions, e.g. hippocampus vs. parietal cortex
Spatial Smoothing Why do you want to do it? • Enables averaging across subjects • Reduces influence of functional and/or anatomical differences between subjects • Even after realignment and normalisation, residual between-subject variability may remain • Smoothing data improves probability of identifying commonalities in activation between subjects, but trade-off with anatomical specificity
Spatial Smoothing Why do you want to do it? • Allows use of Gaussian Field Theory for thresholding • Assumes error terms are roughly Gaussian in form • Requires FWHM to be substantially greater than voxel size • Enables hypothesis testing and dealing with multiple comparison problem in functional imaging …
Overview • Spatial Smoothing • What does it do? • How is it done? • Why do you want to do it? • Correction for Multiple Comparisons • Bonferroni correction • Random field theory • Uncorrected thresholds • False discovery rate • Which correction method to use?
Correction for Multiple Comparisons What is the problem? • Typically in hypothesis testing, the null hypothesis is rejected if ≤ 5% probability effect emerged by chance • If 100 tests are done, this means that on average, 5 will be significant by chance • In the brain, there are many thousands of voxels • Unless this is corrected for, may have many false positive voxels and may reject the null hypothesis incorrectly • Evidence against null hypothesis relates to volume of values, so need to calculate family-wise error rate (FWE)
Correction for Multiple Comparisons Why not do Bonferroni correction? • In behavioural experiments, might adjust threshold for rejecting the null hypothesis depending on the number of independent tests: ' = / n • But in functional imaging, there is typically correlation between signal in neighbouring voxels • This means there is likely to be fewer independent values in the brain volume than there are voxels • Therefore Bonferroni correction is way too conservative
Correction for Multiple Comparisons Random field theory • Allows thresholds to be determined for smooth statistical maps, such as those found in functional imaging • Procedure: • Estimate smoothness (spatial correlation) of data • Calculate expected Euler characteristic (EC) at different thresholds • Calculate threshold for required control of false positives
Correction for Multiple Comparisons Estimating smoothness • Calculate number of resels in image • Resels = resolution elements • Number of resels similar to number of independent observations (but not identical) • Defined as a block of pixels of same size as FWHM of smoothing kernel 10 10 -5 0 5 Gaussian kernel Resel
Correction for Multiple Comparisons Calculating expected Euler characteristic • Property of an image after it has been thresholded • Can be thought of as number of “blobs” in image • At high thresholds, EC drops towards zero • expected EC corresponds to probability of finding an above threshold blob in image Smoothed data Thresholded at Z > 2.75, EC = 2 Thresholded at Z > 3.5, EC = 1
Correction for Multiple Comparisons Calculating expected EC and threshold • If number of resels is known, it is possible to calculate the expected EC at any given threshold • If x is the Z score threshold that gives expected EC of 0.05 • Threshold image at x • There is ≤ 5% probability that any remaining blobs have occurred by chance • Note that this threshold x depends only on number of resels
Correction for Multiple Comparisons Results in SPM2 • Expected EC for peak of each cluster shown in ‘PFWE-corr’ column
Correction for Multiple Comparisons Results in SPM2 • Expected EC for peak of each cluster shown in ‘PFWE-corr’ column • Values in ‘Puncorrected’ column refer to uncorrected values ...
Correction for Multiple Comparisons Uncorrected threshold conventions • Many research groups use uncorrected thresholds, such as P < 0.001, considering clusters of ≥ 5 voxels as significant • Tends to be more ‘sensitive’ than RFT correction • Officially considered bad practice because not clear how this threshold relates to FWE • But often used on basis of control studies finding no false positive activations during visual fixation using these conventions (e.g., Zarahn et al., 1997 NeuroImage)
Correction for Multiple Comparisons Results in SPM2 • Values in ‘PFDR-corr’ column refer to False discovery rate ...
Correction for Multiple Comparisons False discovery rate • Alternative method of inference • Based on observation that subjects vary within an experiment in degree of overall signal exhibited • Suggests different thresholds may be appropriate for different subjects • FDR is proportion of false positive voxels amongst voxels declared positive • cf. FWE which is proportion of false positive voxels amongst all voxels in volume whether or not declared positive
Correction for Multiple Comparisons Which correction method to use? • Bonferroni, FWE, uncorrected, FDR ... • FWE is most “correct” method, but FDR may be more sensitive in some cases • May be a good idea to use whatever method is employed in previous related studies, to increase comparability • Most important point is to decide on correction method a priori, rather than subjectively adjusting thresholds to give desirable results!