Download
1 / 60
610 likes | 713 Views
Chapter 1: Examining Distributions. 1.1 Displaying Distributions with graphs.

E N D
Many public health efforts are directed toward increasing levels of physical activity. “Physical Activity in Urban White, African American, and Mexican American Women” (Medicine and Science in Sports and Exercise [1997]) reported on physical activity patterns in urban women. The accompanying data set given the preferred leisure-time physical activity for each of 30 Mexican American Women. The following coding is used; W=walking, T=weight training, C=cycling, G=gardening, A=aerobics. W T A W G T W W C W T W A T T W G W W C A W A W W W T W W T Construct what you think is an appropriate graph to display this information.
The chronicle of Higher Education (August 31, 2001) reported graduation rates for NCAA Div. 1 schools. The rates reported are the % of full-time freshmen in fall 1993 who had earned a bachelor’s degree for August 1999.California: 64 41 44 31 37 73 72 68 35 37 81 90 82 74 79 67 66 66 70 63Texas: 67 21 32 88 35 71 39 35 71 63 12 46 35 39 28 65 25 24 22
Individual Definition: Pg. 4-19 Variable Definition: Categorical Definition: Examples: Types of graphs used: Quantitative Definition: Examples Types of graphs used:
Individual Definition: object described by a set of data Pg. 4-19 Variable Definition: characteristic of an individual Categorical Definition: placing into group or category Examples: gender, race, smoker, marital status Types of graphs used: bar graph; pie chart Quantitative Definition: Numerical values as a result of a measurement Examples: age, blood pressure, salary Types of graphs used: histogram, stemplot, time plot
Bar Graph (pictograph) What does the height show? count or % Does graph need to include all categories? no Pg 8 #1.3 & 1.4 Pie Chart Shows? Visual for comparison with whole group Does graph need to include all categories? yes Categorical Variable
Frequency Rating 0 - 2 20 3 - 5 14 6 - 8 15 9 - 11 2 12 - 14 1 Histogram
Histogram • Has a horizontal axis that often represents groups of data rather than individual data • Method: • Divide data into classes of equal width (5-15) • Count number in each class • Draw bar graph with no space between bars • Example: NCAA
The chronicle of Higher Education (August 31, 2001) reported graduation rates for NCAA Div. 1 schools. The rates reported are the % of full-time freshmen in fall 1993 who had earned a bachelor’s degree for August 1999.California: 64 41 44 31 37 73 72 68 35 37 81 90 82 74 79 67 66 66 70 63Texas: 67 21 32 88 35 71 39 35 71 63 12 46 35 39 28 65 25 24 22
A B C D E F Histograms These six histograms each describe the same set of data from Table 1.2 on page 11 of your book. Which one is most useful? least useful? Why?
Interpreting histograms • Look for overall pattern & striking deviations • Describe shape, center, and spread • Symmetric • Skewed to the right – right side extends much farther out than the left side
Quantitative variable cont. • Stemplot • For small data sets • Quicker to make and presents more detailed info • Stem consists of all but final, rightmost digit, and leaf is the final digit • Example: NCAA • Time plot • To show a change over time • Example: pg 19 #1.10
The chronicle of Higher Education (August 31, 2001) reported graduation rates for NCAA Div. 1 schools. The rates reported are the % of full-time freshmen in fall 1993 who had earned a bachelor’s degree for August 1999.California: 64 41 44 31 37 73 72 68 35 37 81 90 82 74 79 67 66 66 70 63Texas: 67 21 32 88 35 71 39 35 71 63 12 46 35 39 28 65 25 24 22
What kind of graph would be appropriate? • Whether a spun penny lands “heads” or “tails” • The number of calories in a fast food sandwich • The life expectancy of a nation • The occupational background of a Civil War general • The weight of an automobile • For whom an American voted in the 1992 Presidential election • The age of a bride on her wedding day • The average low temperature in January for Appleton
In trying to make the graph more visually interesting by replacing the bars of a bar chart with milk buckets, areas are distorted.
Another common distortion occurs when a third dimension is added to bar charts or pie charts. The 3-D version distorts the areas, and as a consequence, is much more difficult to interpret correctly.
It is common to see scatterplots with broken axes, but be cautious of time plots, bar graphs, or histograms with broken axes. Broken axes in time plots can exaggerate the magnitude of change over time.
In bar graphs and histograms, the vertical axis should never be broken. For example, by starting the vertical axis at 50 exaggerates the gain. The area for the rectangle representing 68 is more than three times the area of the rectangle representing 55.
Information from research studies is sometimes taken out of context. Think critically!
What might be wrong with the following? • Only 3% of the men surveyed read cosmopolitan magazine. • Since most automobile accidents occur within 15 miles of a person’s residence, it is safer to make long trips. • A television commercial claims that “our razor blades are manufactured to such high standards that they will give you a shave that is 50% closer”. • A national health food magazine claims that “95% of its subscribers who follow the magazines recommendation and take megadoses of vitamin C are healthy and vigorous”. • During 1990 there were 234 accidents involving drunken drivers and 15,897 accidents involving drunken pedestrians reported in Danville. Can we conclude that it is safer in Danville to be a drunken driver than a drunken pedestrian?
Review of graphs: Pg 14 #1.7 & 1.8 Pg 20 #1.11, 1.18, 1.19 SAT scores: Make a histogram to better understand data given and interpret the histogram.
Population – the entire group of individuals that we want information about • Sample – part of the population that we actually examine in order to gather information and make conclusions
Mean • Measure of its center or average • µ used for population mean or
Median • Midpoint of distribution • To find median: • Symmetrical distribution – mean and median are close together • Skewed distribution – the mean is farther out in the long tail than is the median http://www.rossmanchance.com/applets/DotPlotAppletAug11/DotPlotApplet.html
Mean Mean Mode Mode Mode = Mean = Median Median Median SYMMETRIC SKEWED LEFT (negatively) SKEWED RIGHT (positively) Mode • Data that is repeated most often
Quartiles • Spread of the middle half of data • To calculate • arrange data in ascending order and locate median • lower quartile (Q1) is the median of the low half of data • upper quartile (Q3) is the median of the upper half • Q1 is larger than 25% of data • Q2 is larger than 50% of data • Q3 is larger than 75% of data
Q1 10.5 Q3 33 Q2 Median 23.5 Find the Quartiles for the following data. 12 35 23 9 5 21 45 56 24 6 28 31 5 6 9 12 21 23 24 28 31 35 45 56
Min Q1 Q2 Q3 Max 5 10.5 23.5 33 56 http://www.rossmanchance.com/applets/DotPlotAppletAug11/DotPlotApplet.html 5 number summary and boxplot • 5 number summary – minimum, Q1, Q2, Q3, maximum • Boxplot – graph of 5 number summary • Best used for side-by-side comparison of more than one set of data • Include numerical scale in the graph
The chronicle of Higher Education (August 31, 2001) reported graduation rates for NCAA Div. 1 schools. The rates reported are the % of full-time freshmen in fall 1993 who had earned a bachelor’s degree for August 1999.California: 64 41 44 31 37 73 72 68 35 37 81 90 82 74 79 67 66 66 70 63Texas: 67 21 32 88 35 71 39 35 71 63 12 46 35 39 28 65 25 24 22
Outliers • An unusually small or large data value • Calculate interquartile range (Q3 – Q1) • An observation is an outlier if it falls more than 1.5 times the IQR above Q3 or below Q1
Standard Deviation • Measures spread by looking at how far the observations are from their mean • Variance formula: • Standard deviation formula: • s used for sample data; σ is used for population (equation is slightly different)
6.5 4.2 6.6 5.4 6.7 5.8 6.8 6.2 7.1 6.7 7.3 7.7 7.4 7.7 7.7 8.5 Bank of Providence 7.7 9.3 7.7 10.0 Jefferson Valley Bank Mean Median Mode 7.15 7.20 7.7 7.15 7.20 7.7 Waiting Times of Bank Customers at Different Banks (in minutes) • Jefferson Valley Bank • Bank of Providence What is the Standard Deviation of the data from JV Bank? from BofP?
Dotplots of Waiting Times Visually, which one has the greater spread?
Calculate the mean & standard deviation for each set of test scores
Calculate the mean & standard deviation for each set of test scores
Choosing a summary • The five number summary is used for describing a skewed distribution or a distribution with outliers • Use mean for reasonably symmetric distributions that are free of outliers
Section 1.2 practice Pg 41 - 45 #1.35, 1.38, 1.47, 1.48, 1.49
1.3 Normal Distributions Compact picture of the overall pattern of the data
Density curve pg 46 & 47 Scores on national tests often have a regular distribution symmetrical partial area represents % of total “students” (observations) make total area under curve equal one
Normal Distributions pg 51-52 • What are they? • Density curves that are symmetrical, single-peaked, and bell-shaped • Curve is described by its . . . • mean µ and standard deviation σ • Where is the mean located? • at the center of the curve • What controls how spread out the curve is? • Standard deviation controls the spread; the larger the σ the more spread out the data • Where is the σ on the curve? • at the points of change of curvature
Why are normal curves important? • Good descriptions for some distributions of real data (scores on tests, measurements of same quantity, characteristics of biological populations) • Good approximations to the results of many kinds of chance outcomes (tossing coin, rolling die)
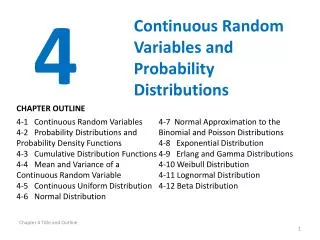
68-95-99.7 rule In a normal distribution: • 68% of the observations fall within 1 of the mean • 95% of the observations fall within 2 of the mean • 99.7% of the observations fall within 3 of the mean http://www.rossmanchance.com/applets/DotPlotAppletAug11/DotPlotApplet.html
0.1% 68% within 1 standard deviation 95% within 2 standard deviations 99.7% of data are within 3 standard deviations of the mean 34% 34% x - s x+s 13.5% 2.4% 13.5% 2.4% 0.1% x - 2s x+2s x - 3s x+3s x 68-95-99.7 rule