Download
1 / 49
490 likes | 601 Views
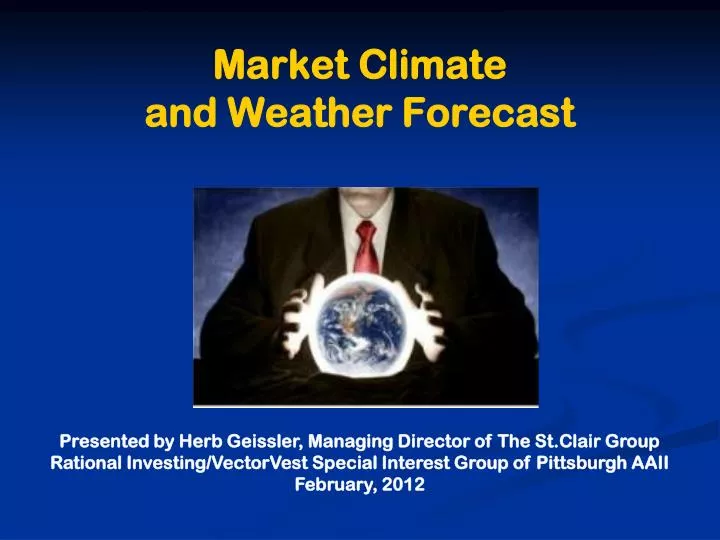
Market Climate and Weather Forecast. Presented by Herb Geissler, Managing Director of The St.Clair Group Rational Investing/VectorVest Special Interest Group of Pittsburgh AAII February, 2012. Three Time Horizons. Secular Overview to determine best broad investing strategies over years

E N D
Market Climateand Weather Forecast Presented by Herb Geissler, Managing Director of The St.Clair Group Rational Investing/VectorVest Special Interest Group of Pittsburgh AAII February, 2012
Three Time Horizons Secular Overview to determine best broad investing strategies over years Cyclical Climate over next year or so for specific strategies to get good gains Current Weather Conditions for what to do over next few weeks and months
Simple Buy & Hold Not Likely to Be Productivefor the next dozen years 15-20 year Consolidating Bear Market Ten-fold, 15-20 year Big Bull Market Kuznets’ Infrastructure cycle averages 17.6 years for each bull or bear phase
Demographics Dictate Destiny Only halfway through to trough-bottom in 2017 20 year slope-shifts in the M2Y ratio match Kuznets’ cycle
Consumptive Spending leaves little over for future users and for economic growth Gross Domestic Product consists of: • Private Consumption Demand, plus • Gross Fixed Investment Spending, plus • Government Consumptive Spending (all levels) • Plus/minus exports and imports
US Government SpendingSqueezes Private Sector Growth and Consumer Spending
Corporate Profits Generally Track Growth in GDP Although Exogenous Events can “put a thumb on the scale” Credit Crunch Oil Crisis Asian Crisis
Long Term GDP Growth depends on Fixed Investment Component • Residential Fixed Investment is mostly private and rental housing. Is very cyclical: • Birth rates and aging • Employment income levels • Low mortgage interest rates • Non-Residential Fixed Investment is primarily production facilities and distribution infrastrure • Spending is based on expected future returns from profitably filling economic needs
Economic Growth Driven by “Permanent” Investments Latest Readings 4Q/11 +2.8% 3Q/11 +15.7%
Huge Surge in Unemployed,14 million looking for a job (duration double norm),despite 3.2 million recorded job openings
Massive Structural Unemployment 9% jobless rate actually closer to 20% Low-cost countries displaced US workers Technology is obsoleting many jobs USPS cut 110,000 jobs in past 4 years and must cut 220,000 more from 572,000 in next 5 years Austerity requires doing more with less Education systems are geared to yesterday Siemans’ US 70,000 employees plus 3,000 open Spiral: less income means less demand
Secular Challengesduring this decade Increasing structural unemployment Declining GDP means less output and fewer jobs Massive global debt requires austerity and write-offs Global politicians unwilling to resolve problems, kicking can down road Lacking confidence in political leaders, both industry and consumers retrench
To Correct Structural Unemployment and Economic Malaise Pay-down U.S. debt to sustainable level through austerity first and then economic growth Slicing less painful than slivering over several years Create 10 million “new” jobs (20% more than today) Not just service jobs in retailing, distribution and financing. Jobs producing technology products that provide more goods and services from less resources to enhance standard of living
Secular Strategic Game Plan for Investing in this decade Replace mindless Buy&Hold of index or stocks with disciplined tactical allocation (select best asset-class ETFs) and use Dynamic Asset Allocation (market timing) to switch from yesterday’s heroes to strongest horses IVY tactical and dynamic allocation needs a few minutes every month for above average returns and below average drawdown (spreadsheet discs available)
Cyclical ClimateNew Political Agendas and Administrations globallythrough 2013 Still in consolidating bear phase of Kuznets cycle, with Europe sick with sovereign debt, US healing slowly from debt crisis and improving mfg efficiencies, and emerging markets coping with demand shrinkage from their major markets in developed countries Tonight will just focus on US = largest and most familiar for good and cautious investing opportunities
SP500 Tanked, WheneverFed Leading Indicator was under 1% But two-month old data is “stale news” Latest reading November 2011 1.53
For 40 years, ECRI ‘s weekly WLI Called every major SP500 Drop Latest readings: 1/27 +0.3% 1/13 +2.3% 1/.06 +1.0% Positive and rising The leading economic indicator (LEI), published by Economic Cycle Research Institute, is a weighted average of ten different economic and financial indicators.
ISM Production Indexes Plunged Rapidly January 2012 Mfg 54.4 Non-Mfg 53.3 August 2011 Mfg 50.6 Non-Mfg 53.3
Now, ISM Mfg is Slowly Improving Latest Readings 1/12 54.1 12/11 53.9 11/11 52.7 10/11 50.5 Bottomed and rising
SPX Turns Match ISM Non-Mfg Turning Points Mostly retailers and wholesaling Latest Readings 12/11 52.6 11/11 52.0 10/11 52.9 Bobbling down sideways
Presidential CycleFavors 2011 and 2012 2011 Only unprofitable year in over 60 years DJIA Gains during Presidential Cycle This Cycle likely to be much below normal
Rhetoric Causes Trading Ranges 2013 Bull Rally Hinges on Severity of Austerity
2012 Intermediate Strategic ConclusionsWalk softly and carry a big stick • Liquidity from QE2 is gone, Europe is in sovereign debt crisis, emerging markets slowing down all will cause US stocks to sag into seasonal low around Halloween • U.S manufacturing sector becoming healthier from “creative destruction” and better technologies. But investing strategies require selectivity in strategies and vehicles during such uncertain times • Active institutional bottom-fishing in November 2011 produces strong relief rally into February, 2012, as cash hoards put to work • Political uncertainties and posturing delays problem-solving into next administration. Stocks bobble (crab-like) through 2012 into a political relief rally in Fall 2012 • Next administration “forced” to drastically cut spending, paring Government from 20% of GDP closer to historical 15%, increasing job-losses. Big Slice will be received better than frequent small slivers • Thus 2013 likely to be a “blood bath” year for the economy and the stock market. Using Contras and Defensives could be critical to getting positive returns.
Strategy Preferences For Intermediate Term Investors Depends on Who You Are? • Passive Investor is defined by absence of disciplined rules to sell-off losers • “Snooze and lose” has destroyed many nest eggs • Active investors vary in degree of activity • Timing to avoid big losses = dynamic asset allocation = MA12 • Periodic rebalance ETFs = tactical asset allocation = IVY • Monthly weed and refresh of stocks = position trading • Daily or weekly trading = swing trading • Modestly active investors need better tools to trigger sound entry and exits that stay out of harm’s way
Limiting Losses Keeps More of Your Gains Since 1885, the DJIA spent • 32% of time in bear markets, going down • 44% of time getting back to break-even • 24% of time in net bull territory • Data from Ned Davis Research Disciplined timing takes you out of harm’s way, when the bear market begins or in progress. • Keep more of your gains • Recover losses more quickly • Make more money, more of the time • IVY spreadsheet discs are still available at $30
Three Simple Strategiesto stay on the RIGHT side of the market • Exit stocks whenever Index drops below its 12 month moving average • Diversify risk by holding 5 non-correlated ETFs only when each above its 10 month MA • Find single best-class to boost return, with moderate drawdown, by holding the “top performing” ETF of the 5, refresh monthly
What Now??? • For Position Traders, holding for months • For Swing Traders, holding for weeks
For Position traders, SPY Has Moved into Bullish Territoryand May break Overhead Resistance
For Position traders, Cautiously Bullish in IVYat end of January 2012 • IVY BASIC is holding VTI (US Large Caps), VNQ (Real Estate) and IEF (Bonds) for 60% invested • IVY TOP is holding VNQ
Weather Forecastfor More Active Investors When the facts change, I change my position. What do you do, sir? - John Maynard Keynes
2011 Frustrated with Trading Rangesand Short, Spiky Trend-Surges 2009 2010 2011
For Swing Traders, VectorVest Primary Wave Up on 10/6, Confirmed Up on 10/24
McClellan Summation Index(MA20)Turned Bullish on October 13thand Retested Price with higher low at Xmas For Swing Traders,
For Swing Traders, Risk Aversion is Now Gone in a liquidity melt-up, as Europe addresses sovereign debt issues Risk aversion = FEAR Over Confidence =GREED
Longs Make Money When SPXA50has +MACD and is Above MA200 or 50% For Swing Traders, MA20 suggests current rally has legs to run for at least a few more weeks
For Swing Traders, 50/50/0 Rules Signaled January Bull Strong DMI Suggests More Upside
Weather Forecast:Sunny, but clouds on horizon For Swing Traders, • Bull rally confirmed with December higher low and McC Sum crossing its MA20 in early January • Rally now is broad, with 88% of SPX over MA50s • 50/50/0 strong since Jan 1; wide DMI suggests more weeks of upside from Institutionals’ liquidity rush • But MTI> 1.60 suggests now at an extreme; tightening stops to buy on dips seems prudent • Political rhetoric likely to cause frustrating swings
Recap of Tonight’s Points • Economy and stock market will be distressed for next several years • Three Simple Strategies can protect and enhance wealth, patiently • Position and swing trading can boost returns, whenever market positions advantageously as confirmed by a few indicators
Any Questions ? CDs with the 3 spreadsheets and 3 tutorials are available for $30 here or by mail. Send check and return address to: Herb Geissler 1792 Taper Drive Upper St. Clair, PA 15241