Download
1 / 1
40 likes | 158 Views
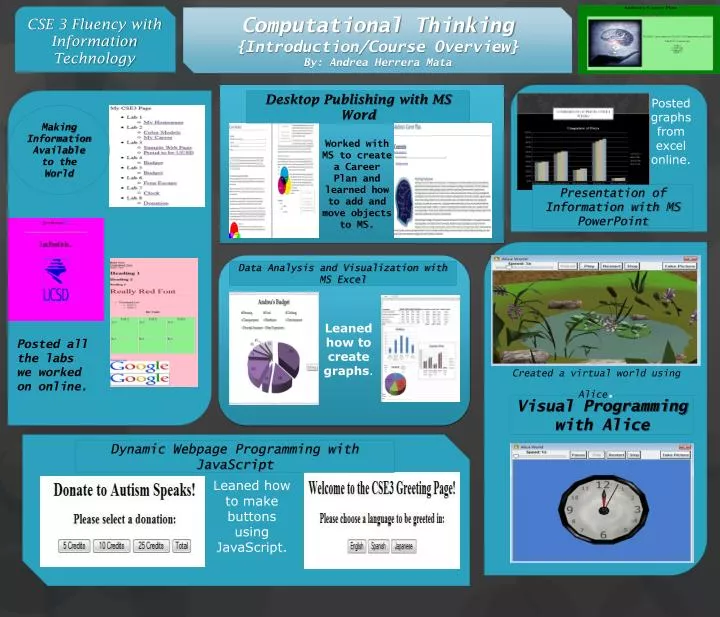
CSE 3 Fluency with Information Technology. Computational Thinking {Introduction/Course Overview} By: Andrea Herrera Mata. Desktop Publishing with MS Word. Posted graphs from excel online. Making Information Available to the World.

E N D
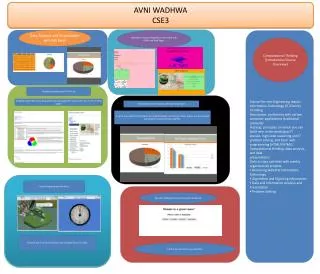
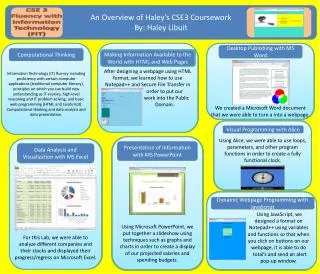
CSE 3 Fluency with Information Technology Computational Thinking {Introduction/Course Overview} By: Andrea Herrera Mata Desktop Publishing with MS Word Posted graphs from excel online. Making Information Available to the World Worked with MS to create a Career Plan and learned how to add and move objects to MS. Presentation of Information with MS PowerPoint Data Analysis and Visualization with MS Excel Leanedhow to create graphs. Posted all the labs we worked on online. Created a virtual world using Alice. Visual Programming with Alice Dynamic Webpage Programming with JavaScript Leaned how to make buttons using JavaScript.