Download
1 / 40
400 likes | 534 Views
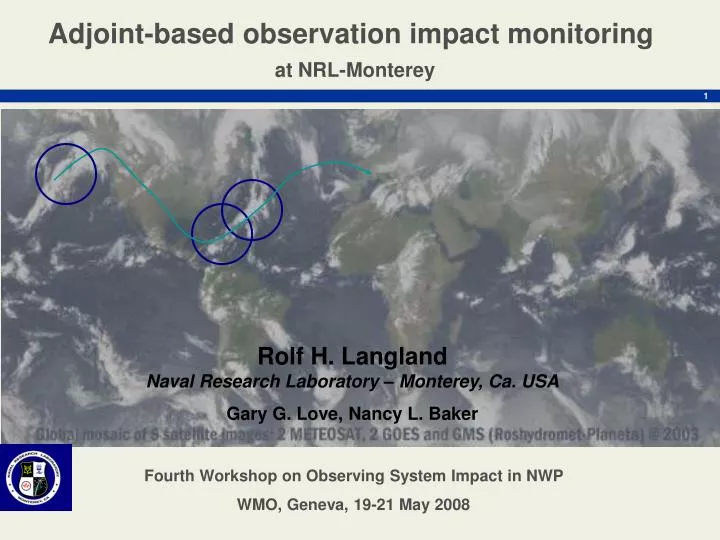
Adjoint-based observation impact monitoring at NRL-Monterey. Rolf H. Langland Naval Research Laboratory – Monterey, Ca. USA Gary G. Love, Nancy L. Baker. Fourth Workshop on Observing System Impact in NWP WMO, Geneva, 19-21 May 2008. Outline of Talk. Methodology Observation impact examples

E N D
Adjoint-based observation impact monitoring at NRL-Monterey Rolf H. LanglandNaval Research Laboratory – Monterey, Ca. USA Gary G. Love, Nancy L. Baker Fourth Workshop on Observing System Impact in NWP WMO, Geneva, 19-21 May 2008
Outline of Talk • Methodology • Observation impact examples • On-line observation monitoring system
Goal for observation impact monitoring system Develop a method to estimate the impacts of all assimilated observations on a measure of short-range forecast error in an operational NWP system Must be computationally efficient – run in near-real-time for routine observation monitoring
Forecast Model and Analysis Procedure Analysis procedure: • NAVDAS: NRL Atmospheric 3d-Variational Data Assimilation System (0.5o lat-lon, 60 levels) • Adjoint provides sensitivity to observations, including moisture data Forecast model: • NOGAPS: Navy Operational Global Atmospheric Prediction System (T239L30) • Adjoint run at T239L30, includes simplified vertical mixing, large-scale precipitation
eg ef xg xf xt xb xa t= 24 hrs t= -6 hrs t=0 Observation Impact Concept Observations move the forecast from the background trajectory to the trajectory starting from the new analysis In this context, “OBSERVATION IMPACT” is the effect of observations on the difference in forecast error norms (ef - eg) 6 hr assimilation window Langland and Baker (Tellus, 2004)
Forecast error norms and differences Global forecast error total energy norm (J kg-1) Forecasts from 0600 and 1800 UTC have larger errors e30 Forecast errors on background-trajectories e24 Forecast errors on analysis-trajectories e24– e30 (adjoint) e24– e30 (nonlinear)
Observation Impact Equation • Dry or moist total energy forecast error norm, f = 24h, g = 30hr • Forecasts are made with NOGAPS-NAVDAS. • Adjoint versions of NOGAPS and NAVDAS are used to calculate the observation impact • The impact of observation subsets (separate channels, or separate satellites) can be easily quantified
Observation impact interpretation For any observation / innovation … using this error measure < 0.0 theobservation is BENEFICIAL > 0.0 the observation is NON-BENEFICIAL the effect of the observation is to make the error of the forecast started from xa less than the error of the forecast started from xb, e.g.forecast error decrease e.g., forecast error increase
Totalimpact by instrument type – Jan2007 Dry TE Norm (150mb-sfc) Dry TE Norm (150mb-sfc)
Impactsper-observation by instrument type 10e-5 J kg-1 10e-5 J kg-1
Percent of observations that produce forecast error reduction (e24 – e30 < 0)
Impact for AMSU-A channels - NAVDAS-NOGAPS Units of impact = J kg-1 1 – 31 Jan 2007, 00,06,12,18 UTC Ch. peak near 11: 20mb 10: 50mb 9: 90mb 8: 150mb 7: 250mb 6: 350mb 5: 600mb 4: surface Channel 4 5 6 7 8 11 9 10 Beneficial NOAA 15 NOAA 16 NOAA 18
Why do some “good data” have non-beneficial impact ? • Observation and background error statistics for data assimilation cannot be precisely specified • This implies a statistical distribution of beneficial and non-beneficial observation impacts • Assimilating the global set of observations improves the analysis and forecast, even though 40-50% of observation data are non-beneficial in any selected assimilation Information about the impact of individual observations and subsets of observations can be used to improve the data assimilation and observation selection procedures
Impact of AMSU-A radiance data Non-beneficial Sum = - 0.906 J kg-1 86,308 observations Beneficial Observations assimilated at 0000 UTC 4 May 2008
Interpretation of observation impact • Non-beneficial impacts: look for data QC issues, instrument accuracy, specification of observation and background errors, bias correction, or model (background) problems … • Beneficial impacts: associated with heavily weighted observations in sensitive regions; “good”, but extreme impacts indicate need for greater observation density … Best strategy: many observations which produce small to moderate impacts, not few observations which produce large impacts …
Example 1: AMV impact problem Date: Jan-Feb 2006 Issue: Non-beneficial impact from MTSAT AMVs at edge of coverage area ActionTaken: Data provider identified problem with wind processing algorithm.
Restricting SSEC MTSAT Winds 500 mb Height Anomaly Correlation Southern Hemisphere Restricted Winds Control February 16 – March 27, 2006
Example 2: Ship data problem Date: Jan-Feb 2006 Issue: Some ship data having non-beneficial impact Actions Taken: Ship ID blacklist implemented; increase wind observation error for ship data (previously was equal to radiosonde surface wind error) SEA ARCTICA – one of the “problem” ships
Example 3: AMSU-A over land surface Date: Jan-Feb 2006 Issue: Some AMSU-A channels over-land surfaces produce non-beneficial impact Action Taken: Investigate bias correction dependence on land surface temperature
AMMA RAOB Temperature Ob Impacts May-Oct 2006 BANAKO:61291 SUM= -0.5755 J kg-1 TAMANASET:60680 SUM= -0.2791 J kg-1
AMMA RAOB Summary Ob Impacts Aug 2006 SOP Largest Fcst Error Reductions < -0.10 J kg-1 Fcst Degradations
Current Uncertainty in Analyzed 500mb Temperature – Operational Systems RMSD
Applications of observation impact information • Adjoint-based observation impact information is a valuable supplement to “conventional” data impact studies (OSEs, OSSEs) • Provides quantitative information about every observation that is assimilated and spatial patterns in observation impact • Identifies possible problems with NAVDAS (observation and background error, bias correction, etc.) • Information is relevant to QC issues and daily monitoring of observations in operational data assimilation
On-line observation Impact monitor www.nrlmry.navy.mil/ob_sens/
Time-series of observation impact www.nrlmry.navy.mil/ob_sens/
Menu for upper-air satellite wind plots www.nrlmry.navy.mil/ob_sens/
MTSAT: 300-500 hPa wind obs www.nrlmry.navy.mil/ob_sens/ 30-day cumulative impact 30-day mean innovation
MTSAT: 300-500 hPa wind obs www.nrlmry.navy.mil/ob_sens/ 30-day cumulative impact 30-day mean wind speed
MDCRS Level-Flight: wind obs www.nrlmry.navy.mil/ob_sens/ 30-day cumulative impact
NAVDAS-AR 8 Apr - 7 May 2008 00UTC observations 4d-VAR Impact per-observation (10-5 J kg-1) hours after hours before Analysis Time
Summary • An adjoint-based system has been developed for daily (currently for 00UTC) monitoring of all observations used in data assimilation (3d-VAR and 4d-VAR) at NRL-FNMOC • Computational cost is slightly less than the regular data assimilation and (24h) nonlinear forecast • Information can be used for observation quality-control and improvement of the data assimilation procedure – valuable supplement to data-denial or data-addition experiments
ObSens Monitor Design • Pre-Processing • Bin statistics into 2.5 degree grid • Sort data combinations, totals and groups • Web-Processing • Provide top-level overviews and time lines • Present comprehensive menus of choices • Render on-demand maps, charts and time lines • Archiving • Zip 90-day old data, unzip as needed
ObSens Pre-Processing • Ingest obsens_52.$dtg • Calculate stats for $dtg, and 30-day and 1-yr stats • Calculate impact average and sum by category • Create category bar chart and time bar chart • Create 2.5 degree binned grids for $dtg • By data category, channel, variable type as appropriate • For seven hPa pressure levels: • sfc-901, 900-801, 800-701, 700-501, 500-301, 300-101, 100-10 AWK script GrADS script stats obsens_52.$dtg rd_obsens (C-code) grids
ObSens Web-Processing • Display top page with bar and time charts • Show other bar and time charts on mouse roll-over • Present menus for Observation Category • For selected Observation Category, present: Combinations of platform, pressure, channel, variable, etc. parameter: counts, ob value, innovation, impact, sensitivity geo area: global, northern hemisphere, southern hemisphere Totals for All platforms, pressures, channels, variables, etc. Groups for classes satellite/aircraft types: All GOES, SSEC, Ascending, etc. • On Demand • Calculate 30-day/1-year grid stats • Create map plots and time lines Menu page html Display page html Tcl cgi Javascript GrADS script grids
ObSens Archiving • Compress data grids over 90-days old • Sparse grids compress 50:1 • Uncompress data on-demand: ~ 2 sec/grid • Leave on-demand data uncompressed • Assuming future interest in uncompressed data grids GrADS script Unzip and open file Zip grids
Data Assimilation Equation BACKGROUND (6h) FORECAST ANALYSIS OBSERVATIONS Temperature Moisture Winds Pressure
Adjoint of Assimilation Equation Sensitivity to Observations: Adjoint of forecast model produces sensitivity to Sensitivity to Background: Baker and Daley 2000 (QJRMS)
Example 3: Isolated aircraft tracks AMDAR Level Flight Hong Kong - LAX Date: First noticed Jan 05, ongoing in several regions Issue: aircraft flies in jet max eastbound, outside of jet max westbound: observation error representativeness problem ? Action Taken: Possible change to observation error Non-beneficial observations
Example 4: QC for land observing stations KQ-MIL Stations AK-METAR Stations Conventional Land Stations Date: Jan-Feb 2005 Issue: Land station observation problems linked to high elevation and cold surface temperatures (METAR), also problems with station elevation metadata (MIL, conventional) Actions Taken: Selected stations blacklisted, data flagged if stations above 740m, or above 300m and background temperature below -15°C