Download
1 / 21
210 likes | 221 Views
Chapter 11 Analyzing the Association Between Categorical Variables. Section 11.3 Determining the Strength of the Association. Analyzing Contingency Tables. Is there an association? The chi-squared test of independence addresses this.

E N D
Chapter 11Analyzing the Association Between Categorical Variables Section 11.3 Determining the Strength of the Association
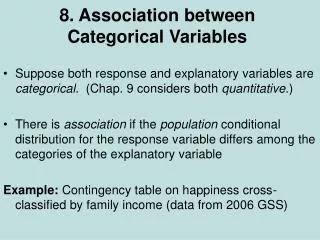
Analyzing Contingency Tables • Is there an association? • The chi-squared test of independence addresses this. • When the P-value is small, we infer that the variables are associated.
Analyzing Contingency Tables • How do the cell counts differ from what independence predicts? • To answer this question, we compare each observed cell count to the corresponding expected cell count.
Analyzing Contingency Tables • How strong is the association? • Analyzing the strength of the association reveals whether the association is an important one, or if it is statistically significant but weak and unimportant in practical terms.
Measures of Association • A measure of association is a statistic or a parameter that summarizes the strength of the dependence between two variables. • A measure of association is useful for comparing associations to determine which is stronger.
Difference of Proportions • An easily interpretable measure of association is the difference between the proportions making a particular response. Table 11.12 Decision About Accepting a Credit Card Cross-Tabulated by Income.
Difference of Proportions • Case (a) in Table 11.12 exhibits the weakest possible association – no association. The difference of proportions is 0. • Case (b) exhibits the strongest possible association: The difference of proportions is 1.
Difference of Proportions • In practice, we don’t expect data to follow either extreme • (0% difference or 100% difference), but the stronger the • association, the larger the absolute value of the • difference of proportions.
Example: Student Stress, Depression and Gender • Which response variable, stress or depression, has the stronger sample association with gender? Why? Table 11.13 Conditional Distributions of Stress and Depression, by Gender
Example: Student Stress, Depression and Gender • Which response variable, stress or depression, has the stronger sample association with gender? • The difference of proportions between females and males was 0.35 – 0.16 = 0.19 for feeling stressed. • The difference of proportions between females and males was 0.08 – 0.06 = 0.02 for feeling depressed. Table 11.13 Conditional Distributions of Stress and Depression, by Gender
Example: Student Stress, Depression and Gender • In the sample, stress (with a difference of proportions = • 0.19) has a stronger association with gender than • depression has (with a difference of proportions = 0.02).
The Ratio of Proportions: Relative Risk • Another measure of association, is the ratio of two proportions: . • In medical applications in which the proportion refers to an adverse outcome, it is called the relative risk.
Example: Seat Belt Use and Outcome of Auto Accidents • Treating the auto accident outcome as the response variable, find and interpret the relative risk. Table 11.14 Outcome of Auto Accident by Whether or Not Subject Wore Seat Belt.
Example: Seat Belt Use and Outcome of Auto Accidents • The adverse outcome is death. • The relative risk is formed for that outcome. • For those who wore a seat belt, the proportion who died equaled 510/412,878 = 0.00124. • For those who did not wear a seat belt, the proportion who died equaled 1601/164,128 = 0.00975.
Example: Seat Belt Use and Outcome of Auto Accidents • The relative risk is the ratio: • 0.00124/0.00975 = 0.127 • The proportion of subjects wearing a seat belt who died was 0.127 times the proportion of subjects not wearing a seat belt who died.
Example: Seat Belt Use and Outcome of Auto Accidents • Many find it easier to interpret the relative risk but • reordering the rows of data so that the relative risk has • value above 1.0. • Reversing the order of the rows, we calculate the ratio: • 0.00975/0.00124 = 7.9 • The proportion of subjects not wearing a seat belt who died was 7.9 times the proportion of subjects wearing a seat belt who died.
Example: Seat Belt Use and Outcome of Auto Accidents • A relative risk of 7.9 represents a strong association • This is far from the value of 1.0 that would occur if the proportion of deaths were the same for each group. • Wearing a set belt has a practically significant effect in enhancing the chance of surviving an auto accident.
Properties of the Relative Risk • The relative risk can equal any nonnegative number. • When , the variables are independent and relative risk = 1.0. • Values farther from 1.0 (in either direction) represent stronger associations.
General Happiness and Marital Happiness Describe the association between marital happiness and general happiness, using the not too happy and very happy categories. Table 11.14 Outcome of Auto Accident by Whether or Not Subject Wore Seat Belt.
Large Does Not Mean There’s a Strong Association • A large chi-squared value provides strong evidence that • the variables are associated. • It does not imply that the variables have a strong • association. • This statistic merely indicates (through its P-value) how • certain we can be that the variables are associated, not • how strong that association is. • For a given strength of association, larger values occur • for larger sample sizes. Large values can occur with • weak associations, if the sample size is sufficiently large.