Download
1 / 15
150 likes | 272 Views
31/07/2014. Rates of Reactions. L.O. I can show experimentally how concentration affects the rate of reaction and plot a graph of my results. 3:32 PM. Recapping last lesson. Backs of books (no cheating!!) List the 4 factors that affect the rate of reaction. Increased concentration.

E N D
31/07/2014 Rates of Reactions • L.O. • I can show experimentally how concentration affects the rate of reaction and plot a graph of my results. 3:32 PM
Recapping last lesson Backs of books (no cheating!!) List the 4 factors that affect the rate of reaction • Increased concentration Learn these!!! • Increased temperature • Increased surface area • Use of a catalyst
Leave a page for method sheet and then draw a results table shown on next slide.
Read practical sheet and watch teacher demo of method. Wear goggles! Take care – concentrated acids!!
1. Put a 1cm length of magnesium ribbon into each of the wells E1, E2, E3, E4, and E5. 2. Completely fill the 100cm3 conical flask with tap water and push on the bung containing 2 tubes (DO OVER A SINK AS WATER WILL FLOOD OUT THE TUBING). 3. Push the blue lid onto well E1 and the other piece of the tubing into a 10cm3 measuring cylinder
4. Fill well F1 with 1M hydrochloric acid and measure out 1cm3 of this acid with a syringe. 5. WITHOUT DEPRESSING IT, place the syringe into the available hole in the blue lid. 6. Depress the syringe and start the stop watch at the same time, DO NOT REMOVE THE SYRINGE. 7. Time how long it takes to collect 10cm3 of gas (measuring displaced water).
8. Repeat the experiment with 2M hydrochloric acid using wells F2 and E2. 9. Continue with the remaining concentrations moving up a well in each case. 10. Plot a graph of time taken against acid concentration.
Homework is to plot a graph of your results using graph paper and write a conclusion. (write what you found out)
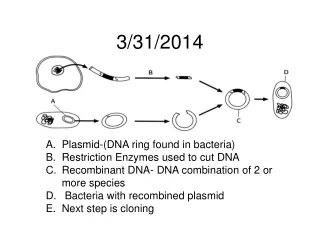
magnesium magnesium chloride + hydrochloric acid + hydrogen HCl Mg Acid and metal – another method • Reactive metals (eg. Magnesium) react with acid to evolve hydrogen gas. Mg(s) + 2HCl(aq) MgCl2(aq) + H2(g) As the gas given off leaves the flask the total mass of the flask and its contents decreases slightly. Readings of the mass(g) can be taken. Typically at 1 minute intervals. 11.71 11.80 11.73 11.71 11.77 11.74 11.72
Plenary questions In today’s experiment which variable should go on the x-axis when you draw a graph of the results? time concentration temperature
Plenary questions For a reaction to occur what must reacting particles do? They must concentrate They must collide They must move fast
Plenary questions What gas is given off when magnesium reacts with hydrochloric acid? hydrogen oxygen chlorine
Plenary questions What did increasing the concentration do to the reaction time? made it slower stayed the same made it faster
Plenary questions What did increasing the concentration do to the reaction rate? decreased it stayed the same increased it