Download
1 / 53
530 likes | 697 Views
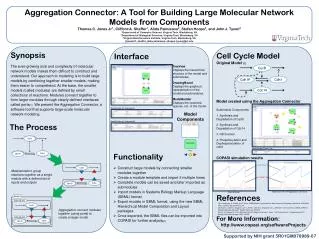
Synopsis. It has been estimated that at least 40% of the total human genome sequence contains the integrated fragments of genomic parasites Retroviruses, Retrotransposons, DNA transposons, and parvoviruses can efficiently insert new sequence into the human genome

E N D
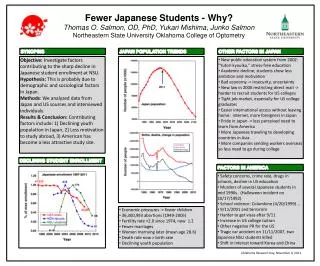
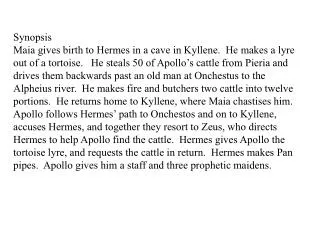
Synopsis • It has been estimated that at least 40% of the total human genome sequence contains the integrated fragments of genomic parasites • Retroviruses, Retrotransposons, DNA transposons, and parvoviruses can efficiently insert new sequence into the human genome • These integrating elements can be powerful tools for discovering . . .
What genomic features affect integration? • Each element shows a different pattern of favorable integration sites • Favored specific nucleotide sequences can be detected in the target DNA at the point of integration for most of these elements • Post-integration genomic DNA is harvested, and the DNA flanking the integrated element is cloned and sequenced
Intention “Present a comprehensive statistical comparison of the factors influencing integration frequency by annotating each base pair in the human genome for its likelihood of hosting integration events”
Framework 7 types of integrating elements 17 different integration complexes (datasets) 200+ variables (genomic features) 10,000+ integration sites
Previous research provided extensive insertion site data • HIV favors integration in active transcription units (TUs) • MLV favors integration near gene 5` ends • ASLV integration is mostly random, but TUs seem to be favored slightly TUs are defined as regions of transcribed DNA
Previous research had provided extensive insertion site data • SFV integration is mostly random, but is favored slightly near CpG islands • SB favors integration in transcription units. • AAV-based vectors show a modest preference for regions neat transcription start sites • Experiments concerning whether LINEs prefer to integrate within TUs have been inconclusive
Some Variables (Genomic Features) • Genes and Exons: Indicator variables for whether the site falls into a gene or an exon • Gene or Expression Density: The number of genes or expressed genes per base pair in the region surrounding the integration site • Dnase I Site Density: The number or density of DNAse I sites in regions surrounding the integration
Some Variables (Genomic Features) • GC Content: The GC percent in the 5kb region containing the site • CpG Islands: The site is in a CpG island • CpG Island Density: The number or density of CpG islands in the region surrounding the site • Transcription Start/Stop Features: The relation of the site to transcription start/stop position
Some Variables (Genomic Features) • Positional Weight in Flanking Sequence: The loglikelihood for integration versus control site at each position in twenty bases of flanking sequence (10 upstream and 10 downstream) and their sum • Loglikelihood is defined as the log ratio of the frequency of each of the four bases at each position to the frequency in the controls
Control Site Generation Each dataset has one of two types of control: • Matched (preferred): the integration sites were created using a restriction enzyme. The control site matches the distance from the nearest restriction site in the direction of transcription • Random: The control site is merely a random sequence from the genome
The ROC Curve • Used to analyze the effects of genomic features on integration • Provide a measurement of a predictor variable’s ability to discriminate between two classes of events • This measure can be interpreted as the probability that a randomly drawn integration site will have a value for its genomic feature that exceeds that of a control
The ROC Curve The area under the ROC curve is taken as a measure of the association between genomic feature and the likelihood of an integration event
The ROC Curve The area under the curve is 1.0 when all integration events have higher values for the feature than any control event, and 0.0 for the opposite case.
The ROC Curve Values very near 1.0 occur when higher values of the feature predict integration, and values very near 0.0 occur when lower values of the feature predict integration
The ROC Curve When the area is 0.50, it is equally likely that either has a higher value Values near 0.50 are consistent with having no predictive value
ROC Curve Construction • Values for the integration sites are tallied to create the histogram and the upper tail areas of the histogram, which shows the fraction of integration sites (vertical axis) that have values for the feature that exceed a given value (horizontal axis)
ROC Curve Construction • Repeat this same procedure using data from the control sites • Rotate this histogram and upper tail areas graph 90˚ clockwise • The ROC curve is constructed from the collection of true and false positive rates
ROC Curve Construction • For every possible cutpoint, plot the True Positive Rate on the y-axis and the False Positive Rate on the x-axis A cutpoint is defined as any value of a predictor
A Compact Representationof these Associations • The absolute difference between the area and 0.50 is plotted • Values around 0.0 indicate no useful predictive information in the feature • Values near 0.50 indicate that the feature is nearly perfect in separating integration sites from the controls
Color-coded ‘‘Heat Maps’’ • Color-coded heat maps are matrices displaying associations for each type of genomic feature using rows of the matrix for features and columns for data sets
Color-coded ‘‘Heat Maps’’ • Bright green represents ROC curve areas near 0.0 • Black represents ROC curve areas of 0.50 • Bright red represents ROC curve areas near 1.0
Effects of Nucleotide Sequence of the 20 Base Pairs Surrounding the Point of Integration • To determine how important different features are in directing integration towards a region, each base in the interval is treated as the edge of an integration site
Effects of Nucleotide Sequence of the 20 Base Pairs Surrounding the Point of Integration • Each region is then scored for the expected number of integration events over the interval, and these interval scores are summed
Effects of Nucleotide Sequence of the 20 Base Pairs Surrounding the Point of Integration • The summed values are then tested for their ability to sort experimental integration sites from controls
Effects of Nucleotide Sequence ofthe 20 Base Pairs Surrounding the Point of Integration Interval Size Results are presented as areas under the ROC curve for this variable Integrating Elements
Integration in Transcription Units and the Effect of Gene Activity • Analysis of DNA integration within TU's and exons
HIV: (Red) positively correlated with TU's • Others varied from slight, negative (green) to undistinguishable data (black)
This figure summarizes the effects of gene density in differently sized genomic intervals 100kb-4 Mb • Utilized Affimetrix arrays to do transcriptional profiling • Each expression scores for all genes in a interval divided by interval width • All datasets resulted in weakly positive for insertion in at least one integral. And… • "There was no clear pattern of interval size, type of gene call. or expression level.“ • Suggests that Gene density features were most significant • -Strong effects seen in HIV and MLV datasets • Weakest response from non-dividing cells or macrophage
How does G/C Content and Proximity to CpG Islands Effect Integration? On average, G/C Content implies … • Gene rich • Short introns • High frequencies of ALu repeats • Low frequencies of LINEs • High Frequency of CpGs
2 MLVs where integration was positive • 3 HIVs that were negatively correlated, A/T preference • Other datasets showed weaker and less consistent responses
Whoa!? I Thought HIV Integrated in In Gene Enriched Regions?
Fig. 3 A Fig. 4 A A/T preference of HIV integrase-binding protein
GpC Island density • Increasing length 1K-32 M • Correlates to gene density • Within short regions, proximity to CpG islands correlate to proximity to regulatory regions • Long intervals span many genes
DNase I Cleavage Sites • DNase I cleaves the sites in chromatin where the binding of transcription factors occurs along with the presence of CpG islands, and gene control regions.
Integration Near Transcription Factor Binding Motifs • Summarizes how integration is affected by its proximity to transcription factor binding sites • TRANSFAC PWM- scores how well the integration site or control matches a PWM and this score generates an ROC describing the effects of that PWM • Lack of strength when analyzed with other factors
Proximity to Transcription Start and Stop Features • To compare the integration frequency between start and stop codons for experimental and matched random controls expressed as ROC areas. Fig 4C
Boundary.dx: Distance from 5' or 3' end • Start.dx: distance to the nearest gene start sites • closer to the start (green) • Signed.dx: High probability at the start sites (red) • General.width- length of introns
Improved Models Incorporating Score.20 Together with Other Genomic Features • Score.20 was the most effective method for differentiating between site selection of the different vehicles • Addition of other variables to accentuate our results. • Non-redundant • Lack of correlation
Increase in ROC Area by the Addition of a Genomic Feature • Histogram: Found little correlation of score.20 with other features • Predictors of Integration targeting can be constructed based on score.20 and another feature • The fitting process leads to values that rank higher than random match controls
A Single Model! • Regression models would be too complex • Want to analyze various features • Bayes Model Averaging (BMA) • Reinforces that score. 20 and other features are independent • Models with high posterior probability were collected and used to evaluate the importance of various features • Random sites are scored for the logarithmic odds of integration with BMA models
Hierarchical clustering • Major grouping of retrovirus HIV • Amongst our 17 datasets, with each branch different element types were resolved • Verifies that integration site selection is dominated by element encoded recombination enzymes
What genomic features influence integration of new DNA? What we’ve learned about each integrating element: • HIV favors integration in active transcription units (TUs) • MLV favors integration near gene 5` ends • ASLV integration is mostly random, but TUs seem to be favored slightly • HIV- Found to be weakly attracted to integration sites near DNase 1 cleavage domains over long intervals. Probably because of the correlation of HIV insertion sites and DNase 1 cut sites with gene dense regions. Also revealed a strong integration attraction to A/T rich sequences, contradictory to previous presumptions correlating insertion with C/G dense areas. • MLV- Integration associations with CpG islands and DNase 1 hypersensitive sites found to be amplified when a larger scale of interest is used. The influence of the local nucleotide sequence also increased with a larger interval. Strong correlation for integration near areas of gene expression. • ASLV- Integration near DNase 1 sites over long genomic intervals favored.
What genomic features influence integration of new DNA? What we’ve learned about each integrating element: • SFV integration is mostly random, but is favored slightly near CpG islands • SB favors integration in transcription units. • AAV-based vectors show a modest preference for regions neat transcription start sites • Experiments concerning whether LINEs prefer to integrate within TUs have been inconclusive. Specific sequence known to have effect on integration. • SFV- Cell specific integration influences. Integration near CpG islands and proximity to DNase 1 cut sites more evident in stem cells then fibroblasts. • SB- Contradictory results in regards to proximity to CpG islands and gene density. Possibly because of cell type specific integration influences. • AAV- Of all vectors, integration found least favorable into TU’s. Contradictory to previous mouse liver studies. • L1- Supports previous studies suggesting strong integration site nucleotide relationships.
What genomic features influence integration of new DNA? When asking this question, the scale of interest is very important because it can influence the results. For example; You use a vector that you think integrates near the sequence: GATTACA, When you focus on a 20 bp segment, it can be very easy to predict where the vector will integrate. Conversely, if that same vector is integrated into a 1kbp segment, or 20kb, or 3 billion base pair segment, the integration site is going to be harder to predict. Especially if there are other, less understood influences acting in concert. As seen in our case. Other factors were seen to increase their influence with increased area, as seen in MLV and ASLV.
Future Studies With this catalog of vector-feature interactions, we can better understand novel insertion influences as they’re identified. They can be studied and compared in cooperation with the current comprehensive predictive models incorporating all currently known genomic features. In doing so, we will gain better insertion prediction abilities with each new independent variable genomic feature discovered. One such new feature could be the relative locations of nucleosomes, or other epigenetic factors, like methylation or acetylation of the DNA strand. http://en.wikipedia.org/wiki/Nucleosome
Future Studies This paper mentioned many potential future studies surrounding each individual potential insertion vector, for example, SB cell specific integration and AAV likeliness of TU insertion. Many other areas of research could collaborate upon the findings presented in this article. Stronger mathematical modeling systems could be of great value. http://www.bioscience.heacademy.ac.uk/network/sigs/numeracy/
Future Studies Also using a different approach utilizing the advances in proteomics to isolate and identify some of the functional proteins used by these potential insertion vectors could expand our understanding of the mechanisms used. A bioinformatics data base could then be used to see if there any DNA binding proteins, chromatin related proteins, DNase proteins, DNA ligase proteins, etc were found. http://www.dartmouth.edu/~toxmetal/TXQAas.shtml