Download
1 / 58
590 likes | 602 Views
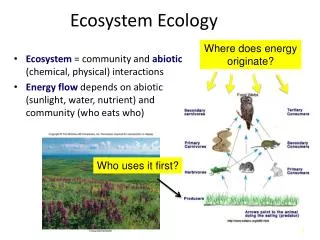
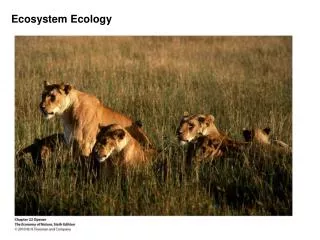
Ecosystem Ecology. Ecosystem Ecology I. Introduction - Ecosystem: an assemblage of organisms, together with their chemical and physical environments. Ecosystem Ecology I. Introduction - “Box Models” of Exchanges (“fluxes”) between “reservoirs”. Ecosystem Ecology I. Introduction

E N D
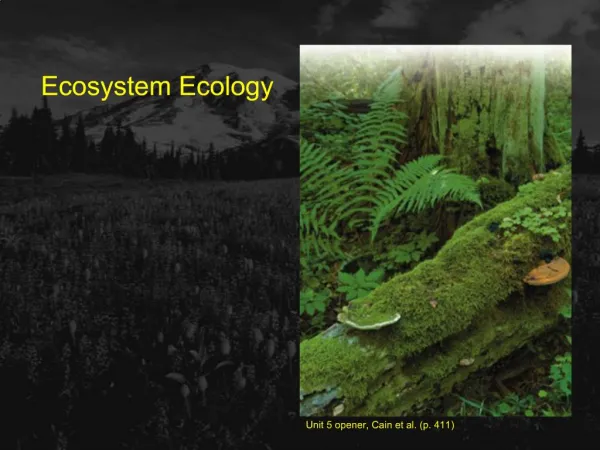
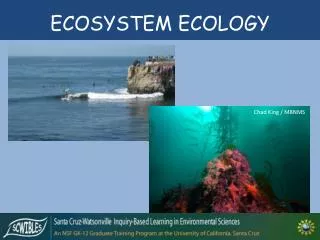
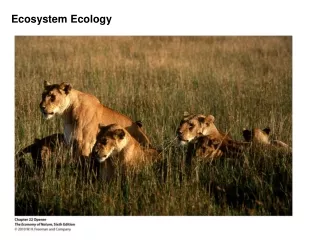
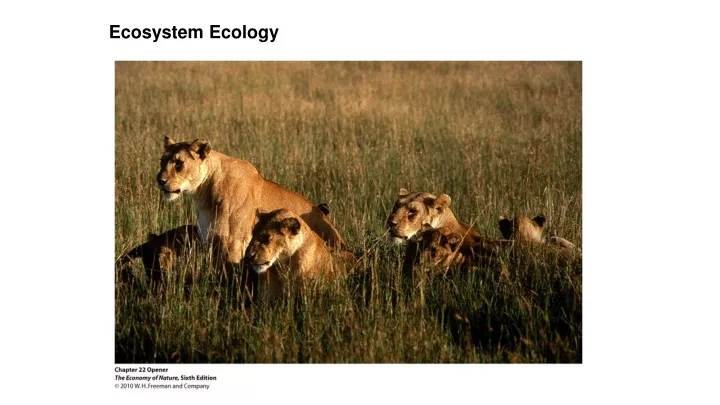
Ecosystem Ecology • I. Introduction • - Ecosystem: an assemblage of organisms, together with their chemical and physical environments
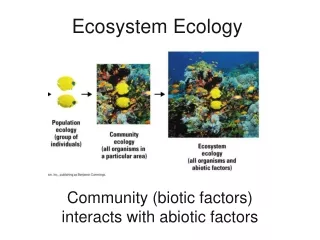
Ecosystem Ecology I. Introduction - “Box Models” of Exchanges (“fluxes”) between “reservoirs”
Ecosystem Ecology I. Introduction II. Energy Flow
Ecosystem Ecology I. Introduction II. Energy Flow A. Productivity 1. Gross Primary Productivity Total photosynthetic productivity: CO2 + H20 -----> Glucose + O2
2. Net Primary Productivity: - energy stored in biomass - Global Patterns
Ecosystem Ecology I. Introduction II. Energy Flow A. Productivity 3. Net Secondary Productivity - Net Production Efficiency = P/A
0.5% Birds Ecosystem Ecology I. Introduction II. Energy Flow A. Productivity 0.7% Shrews 3. Net Secondary Productivity - net production efficiency = P/A 6-10% Most Mammals Up to 75% for sedentary poikilotherms
Ecosystem Ecology • I. Introduction • II. Energy Flow • Productivity • Trophic Pyramids • - ecological efficiency: NSP/NPP (5-20%) NPP of Secondary Carnivores Loss due to 2nd Law NPP of Primary Carnivores NPP of HERBIVORES NPP of Producers (PLANTS)
a. trophic "pyramids" This is why large carnivores are RARE, and why they have large RANGES NPP of Secondary Carnivores Loss due to 2nd Law NPP of Primary Carnivores NPP of HERBIVORES NPP of Producers (PLANTS)
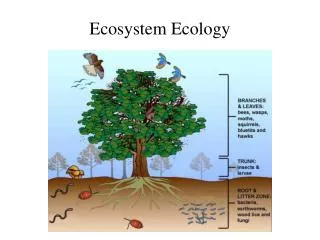
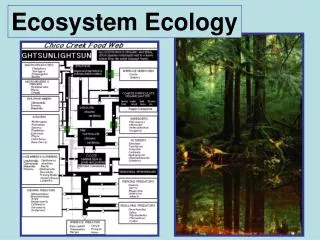
Ecosystem Ecology • I. Introduction • II. Energy Flow • Productivity • Trophic Pyramids • DetritalFoodchains Predators Herbivores
Ecosystem Ecology • I. Introduction • II. Energy Flow • Productivity • Trophic Pyramids • DetritalFoodchains • BAR • Human Concerns
E. Human Concerns A doubling of meat production per capita
E. Human Concerns 6-10 lbs of feed for 1 lb increase in cattle weight 2-5 lbs of fish meal for 1 lb increase in farmed fish weight
Edible kilocalories produced from kilocalories of energy required for cultivation are: 18.1% for chicken, 6.7% for grass-fed beef, 5.7% for farmed salmon 0.9% for shrimp. 123% for potatoes 250% for corn 415% for soy input calories converted to calories able to be utilized by humans E. Human Concerns So, for every 100 calories of energy we put in to raise chickens, we get 18 calories of energy produced in chicken meat. 100 cal into soy, 415 calories out.
E. Human Concerns Food production, per capita (400 kg per year is healthy minimum)
E. Human Concerns EXTENSIFICATION – MORE AREA
E. Human Concerns 47% of historical forested land has been cut
E. Human Concerns INTENSIFICATION
E. Human Concerns The best land has already been used; further expansion in marginal areas is costly and requires more supplementation
E. Human Concerns Global NPP (dry mass) = 224 billion tons. 59% is terrestrial, and of this, 35-40% is controlled by humans, either eaten directly or fed to animals we will consume
Ecosystem Ecology I. Introduction II. Energy Flow III. Biogeochemical Cycles
III. BIOGEOCHEMICAL CYCLES A. Overview Small reservoir “Turns fast” FLUX “Turns slow” Large reservoir
B. The Water Cycle All values in teratons (x 1018 g) Atmosphere (13) OVER OCEAN OVER LAND Rain Evaporation Rain Evaporation (385) (425) (111) (71) Oceans - 97% Runoff and Groundwater (40) (1,380,000)Lakes and Rivers (100) Water content in sedimentary rock near surface (210,000) Biosphere (1)
B. The Water Cycle - Effects of Life 1. Plant biomass pumps water out of the soil into the atmosphere, increasing evaporation rates. 2. Volatiles act as nuclei on which raindrops can form ("Smoky Mountains"), increasing local precipitation. Large forests stimulate the rainfall they depend on.
-Effects of Life: • Cut forest – reduce evapotranspiration, increase runoff and river discharge • Eventually, reduce precipitation, and reduce river discharge.
B. The Water Cycle - Effects of Humans
B. The Water Cycle • Effects of Humans • 1. Control 50% of surface runoff of planet • - 70% agriculture • - 20% industry • - 10% personal use
Most population growth is in tropical/arid areas where more water is needed to grow the same amount of crop, because PET > Precipitation
98% of water ‘footprint’ for animals is for their feed. 30% of all water used for animals is for beef cattle Another 20% for dairy cattle
B. The Water Cycle • Effects of Humans • 1. Control 50% of surface runoff of planet • - 70% agriculture • - 20% industry • - 10% personal use • 2. Dams
2. Dams – Three Gorges, Yangtze River Ship locks
2. Dams – Three Gorges, Yangtzee River 1.5 miles wide, 600 feet high Largest dam in the world – largest engineering project in the world.
1.5 miles wide, 600 feet high Reservoir 570 feet deep and nearly 400 miles long.
Energy = 18 nuke plants. At full power, reduces coal consumption by 31 million tonnes per year, avoiding 100 million tonnes of greenhouse gas emissions 100
Regulate a deadly, flood-prone river: The 1998 flood (before the dam): 3,704 dead, 15 million homeless and $26 billion in economic loss. A staggering 25 million acres (~Kentucky) were evacuated, 13.3 million houses were damaged or destroyed.
Displaced 1.2 million people Cover 1300 important archeological sites
2. Dams – Problems: - Flood upstream habitats - release toxins into water - cause eutrophication - reduce oxygen content of water - sediment buildup decreases “head” and power generation - sediment trap starves downstream of sediment and nutrients – erosion of river delta and loss of productive estuary - reduce fisheries productivity “The construction of dams is increasingly regarded as the biggest conservation threat to aquatic and riparian biodiversity in many river basins throughout the world.” J. Wu, J. Huang, and X. Han. 2003. Science 302:11-49-1150.
B. The Water Cycle • Effects of Humans • 1. Control 50% of surface runoff of planet • - 70% agriculture • - 20% industry • - 10% personal use • 2. Dams • 3. Overtapped Rivers • Major rivers like the Colorado, Nile, Ganges, Yellow • don’t reach the ocean for months at a time – all the • water is drawn off by humans upstream.
Glen Canyon – 710 ft Hoover – 726 ft tall