Download
1 / 39
390 likes | 397 Views
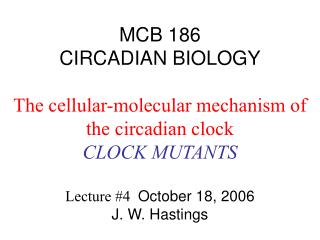
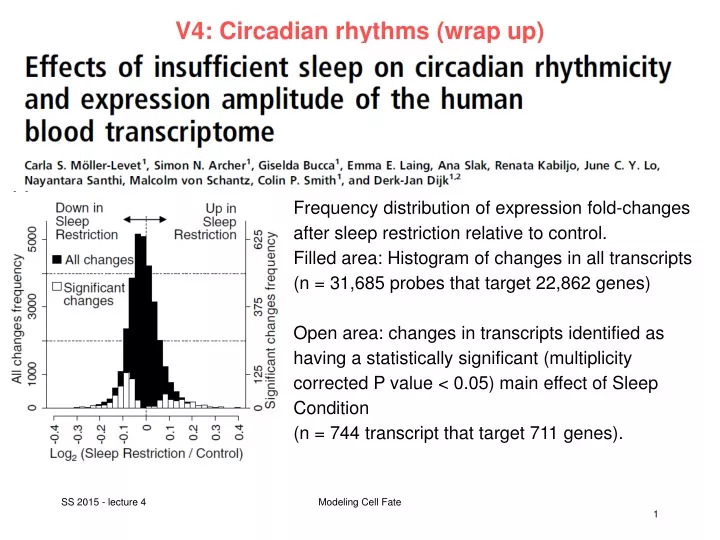
V4: Circadian rhythms (wrap up). Frequency distribution of expression fold-changes after sleep restriction relative to control. Filled area: Histogram of changes in all transcripts (n = 31,685 probes that target 22,862 genes)

E N D
V4: Circadian rhythms (wrap up) Frequency distribution of expression fold-changes after sleep restriction relative to control. Filled area: Histogram of changes in all transcripts (n = 31,685 probes that target 22,862 genes) Open area: changes in transcripts identified as having a statistically significant (multiplicity corrected P value < 0.05) main effect of Sleep Condition (n = 744 transcript that target 711 genes). Modeling Cell Fate
Bonferroni correction for multiple testing Tthe Bonferroni correction is a method used to counteract the problem of multiple comparisons. It is considered the simplest and most conservative method to control the familywise error rate. The Bonferroni correction is based on the idea that if an experimenter is testing m dependent or independent hypotheses on a set of data, then one way of maintaining the familywise error rate is to test each individual hypothesis at a statistical significance level of 1/m times what it would be if only one hypothesis were tested. Carlo Emilio Bonferroni (1892-1960) www.wikipedia.org Modeling Cell Fate
False-discovery rate (FDR) In m hypothesis tests of which m0 are true null hypotheses, R is an observable random variable, and S, T, U and V are unobservable random variables. We can define Q as the ratio of false discoveries : Q = V / R We set V / R = 0 if R = 0. This is the false discovery rate: The Benjamini-Hochberg method is one FDR-method. www.wikipedia.org Modeling Cell Fate
Examples of genes with significant effect of Sleep Condition P < 1 × 10⁻⁶ MFNG: O-fucosylpeptide 3-beta-N-acetylglucosaminyltransferase DCAF5: is a protein-coding gene … RORA: retinoic acid receptor-related orphan receptor alpha is a nuclear hormone receptor – associated with circadian rhythmsPRDX5: peroxiredoxin 5 Greyed areas: melatonin profile averaged for the two conditions. Individual data were aligned relative to the individual melatonin rhythm and sorted into discrete circadian phase bins. Because of the shift in circadian phase after sleep restriction and to individual variation, the 10 melatonin samples covered 11 circadian phase bins after sleep restriction. Modeling Cell Fate
Gene Ontology (GO) Ontologiesarestructuredvocabularies. The Gene Ontologyhas 3 tracks: - biologicalprocess (BP) - molecularfunction (MF) • cellularcomponent (lokalisation). Shownhereis a partofthe BP tree. At the top: mostgeneralexpression (root). Red: leafsofthetree (veryspecific GO terms) Green: commonancestorsof 2 rednodes. Blue: othernodes. Lines: „Y iscontained in X“- relationships Dissertation Andreas Schlicker (UdS, 2010) Modeling Cell Fate
What sort of genes are differentially expressed? The top 10 enriched GO biolo-gical processes and molecular functions within the statistically significant differentially expres-sed gene list as identified by WebGestalt when using the human genome as background. P-values corrected by Benjamini-Hochberg method. Down-regulation: chromatin modification and organization, metabolism Up-regulation: cellular response to oxidative stress and reactive oxygen Modeling Cell Fate
Over-representation analysis 4 servicesusedforover-representationanalysis of GO terms in genesets: 2 with Agilent Probe IDs (1) DAVID (NIH) (2) MetaCoreTM (Thomson-Reuters) • Features Pathway analysis of ‘omics’ data for drug discovery Knowledge mining of the database for hypothesis generation Target and biomarker assessment and validation Disease pathway modeling and investigation of causal mechanisms Patient stratification, comprehensive comparison, and functional fingerprinting 2 with HUGO genesymbols (3) Toppclusteruses the hypergeometric test, Bonferroni/FDR (4) Webgestaltuseshypergeometric test or the Fisher's exact test Huang, Sherman, Lempicki, Nucl. Acids Res. (2009) 37: 1-13 Modeling Cell Fate
Over-representation analysis (WebGestalt) Suppose that we have n genes in the interesting gene set (A) and m genes in the reference gene set (B). Suppose further that there are k genes in A and j genes in B that are in a given category (C) (e.g. a GO category, a KEGG pathway, a BioCarta pathway etc.). Based on the reference gene set, the expected value of k would be ke = (n/m)j If k exceeds the above expected value, category C is said to be enriched, with a ratio of enrichment (r) given by r = k/ke. Zhang, Kirov, Snoddy (2013) Nucl Ac Res 33: W741-W748 Modeling Cell Fate
Over-representation analysis (WebGestalt) If B represents the population from which the genes in A are drawn, WebGestalt uses the hypergeometric test to evaluate the significance of enrichment for category C in gene set A, If A and B are two independent gene sets, WebGestalt uses Fisher's exact test instead, • Interpretation: drawi = k genes for A that • belongtocategory C fromthe j genes from B • thatbelongto C. • The othern – i genes in A do not belongto C. • Theyaredrawnfromthem – j genes in B that • do not belongto C. • Normalizationisdoneby total numberof • possibilitiestodrawn genes fromm genes. Zhang, Kirov, Snoddy (2013) Nucl Ac Res 33: W741-W748 Modeling Cell Fate
Overlap of gene sets Intersection of genes identified as circadian and time-awake–dependentin control and sleep-restriction (SR) conditions. (A) Venn diagram of prevalent circadian genes. (B) Venn diagram of genes identified as having a prevalent time-awake upward trend. (C) Venn diagram of genes identified as having a prevalent time-awake downward trend. Modeling Cell Fate
Effect of sleep restriction on phases of circadian genes Genes with a prevalent circadian variation during the constant routine/total sleep deprivation after the control condition (2,103 probes that target 1,855 genes, FDR <5%). Heatmap rows correspond to the median of the melatonin-aligned probe values across all participants in the control condition. Rows are clustered based on a circular self-organizing map. Cluster means are plotted above as time-series. In parenthesis: number of genes per cluster (C1–C5). Color codes left of heatmap match the colors of the clusters. Genes related to circadian rhythmicity and sleep (according to GO) are indicated in the heatmap (colors indicate cluster location). Modeling Cell Fate
Shift in melatonin-aligned peak times Genes with night peaks (control) are enriched in GO terms for: gene expression, RNA metabolic processes, cellular metabolic processes Genes with day peaks (control): Response to hormone and stress, inflammatory, immune and defense response, interleukin and cytokine activity. Phase histogram of melatonin-aligned peak times of prevalent circadiangenes following and sleep restriction. The distribution of the phases is significantly different between conditions. Modeling Cell Fate
Gene functions of „normal“ circadian genes Top 10 enriched GO BPs and MFs within the circadian gene list of the control condition usingthe human genome as a background. Percentages are based on the number of unique gene symbols annotated as belonging to a specific biological process/ molecular function compared with the number of unique gene symbols within the entire gene list. P values corrected by Benjamini and Hochberg. Modeling Cell Fate
Circadian variations in the transcriptome following control and sleep restriction Genes with a prevalent circadian variation during the constant routine/total sleep deprivation after control and/or sleep restriction (n = 2,859 probes that target 2,510 genes). Heatmap rows correspond to the median of the melatonin-aligned probe values across all participants per sleep condition. Rows are clustered based on a circular SOM. Color codes on the left side of the heat map identify the clusters. Relative clock times and melatonin profiles are average values across all participants per sleep condition. Genes related to circadian rhythmicity and sleep (according to Gene Ontology) are indicated in the heatmap (gene colors indicate cluster location). Modeling Cell Fate
Genes with significant difference in circadian amplitude (B) Examples of genes witha significant difference in circadian amplitude: GHRL, IDSAVIL, and CEACAM3 Modeling Cell Fate
Other results (not further discussed) Modeling Cell Fate
Summary of results Modeling Cell Fate
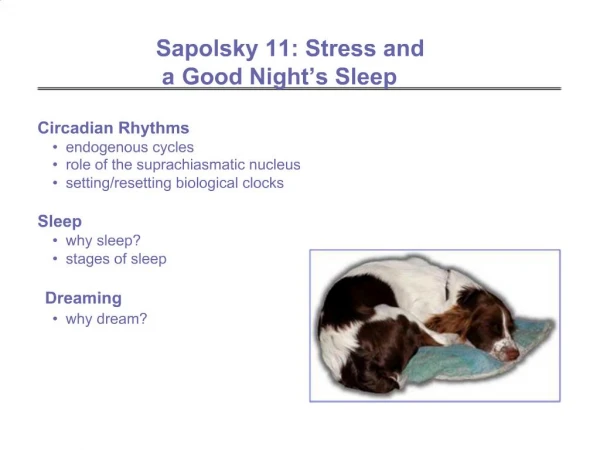
Circadian rhythms are coupled to metabolism O‘Neill et al. Science, 320, 949 (2008) Review: The suprachiasmatic nuclei (SCN) of the hypothalamus are the principal circadian pacemaker in mammals, They drive the sleepwake cycle and coordinate subordinate clocks in other tissues. Current understanding: The molecular clockwork within the SCN is being modeled as a combination of transcriptional and posttranslational negative feedback loops. Protein products of Period and Cryptochrome genes periodically suppress their own expression. Modeling Cell Fate
Control of circadian rhythms? Open question: It is unclear how long-term, high-amplitude oscillations with a daily period are maintained. In particular, transcriptional feedback loops are typically less precise than the oscillation of the circadian clock and oscillate at a higher frequency than one cycle per day. Possible explanations: - phosphorylation causes delay, - secondary loops give stabilization. O‘Neill et al. Science, 320, 949 (2008) Modeling Cell Fate
Evidence for coupling of circadian clocks with metabolism • Recombinant cyanobacterial proteins can sustain circadian cycles of autophosphorylation in vitro, in the absence of transcription, (2) intracellular signaling molecules cyclic adenosine diphosphate–ribose (cADPR) and Ca2+ are essential regulators of circadian oscillation in Arabidopsis and Drosophila. This indicates that transcriptional mechanisms may not be the sole, or principal, mediator of circadian pacemaking. O‘Neill et al. Science, 320, 949 (2008) Modeling Cell Fate
Example of a gene regulatory network O’Neill and co-workers showed that the transcriptional feedback loops of the SCN are sustained by cytoplasmic cAMP signaling. cAMP signaling determines their canonical properties of amplitude, phase, and period. Roles of cAMP? In molluscs, birds, and the mammalian SCN, cAMP is implicated in entrainment or maintenance of clocks, or both, or mediation of clock output. It was not considered as part of the core oscillator sofar. These findings extend the concept of the mammalian pacemaker beyond transcriptional feedback to incorporate its integration with rhythmic cAMP-mediated cytoplasmic signaling. O‘Neill et al. Science, 320, 949 (2008) Modeling Cell Fate
What is cAMP Cyclic adenosine monophosphate (cAMP) is a second messenger that is important in many biological processes. cAMP is derived from ATP and used for intracellular signal transduction in many different organisms, conveying the cAMP dependent pathway. In humans, cyclic AMP works by activating cAMP-dependent protein kinase (PKA). Cyclic AMP binds to specific locations on the regulatory units of the protein kinase, and causes dissociation between the regulatory and catalytic subunits Thus it activates the catalytic units and enables them to phosphorylate substrate proteins. www.wikipedia.org Modeling Cell Fate
Side functions of cAMP There are some minor PKA-independent functions of cAMP, e.g. activation of calcium channels. This provides a minor pathway by which growth hormone releasing hormone causes release growth hormone Picture: Epinephrine (adrenaline) binds its receptor, that associates with an heterotrimeric G protein. The G protein associates with adenylyl cyclase that converts ATP to cAMP, spreading the signal www.wikipedia.org Modeling Cell Fate
Cyclic cAMP levels in mouse brain The molecular oscillations of the SCN were tracked as circadian emission of bioluminescence by organo-typical slices from transgenic mouse brain. Rhythmic luciferase activity controlled by the Per1 promoter (Per1::luciferase) revealed circadian transcription, and a fusion protein of mPER2 and LUCIFERASE (mPER2::LUC) reported circadian protein synthesis rhythms. Circadian oscillation of cAMP concentration (blue) and PER2::LUC bioluminescence (red), as well as cAMP concentration in SCN slices treated with MDL-12,330A (MDL) or with forskolin plus IBMX. Interpretation: Under these conditions, the cAMP content of the SCN was circadian. O‘Neill et al. Science, 320, 949 (2008) Modeling Cell Fate
Effect of MDL Idea: can one show that cAMP is the reason for the oscillations? Realization: need to suppress cAMP-production in the cell. Experiment: treat SCN slices with MDL, a potent, irreversible inhibitor of the enzyme adenylyl cyclase (that synthesizes cAMP) to reduce concentrations of cAMP to basal levels. Interpretation: MDL rapidly suppressed circadian CRE::luciferase activity, presumably through loss of cAMP-dependent activation of CRE sequences. This caused a dose-dependent decrease in the amplitude of cycles of circadian transcription and protein synthesis observed with mPer1::luciferase and mPER2::LUC. O‘Neill et al. Science, 320, 949 (2008) Modeling Cell Fate
MDL also affects the synchronization of the clock Prolonged exposure to mild levels of MDL (1.0 M) suppressed and desynchro-nized the transcriptional cycles of SCN cells. O‘Neill et al. Science, 320, 949 (2008) Modeling Cell Fate
Can one block cAMP action? Time of application of ZD7288 Idea: If cAMP sustains the clock, interference with cAMP effectors should compromise pacemaking. PlanA: treat brain slices with inhibitors of cAMP-dependent protein kinase. This had no effect, however, on circadian gene expression in the SCN. PlanB: But cAMP also acts through hyperpolarizing cyclic nucleotide–gated ion (HCN) channels and through the guanine nucleotide–exchange factors Epac1 and Epac2 (Epac, exchange protein directly activated by cAMP). The irreversible HCN channel blocker ZD7288, which would be expected to hyperpolarize the neuronal membrane, dose-dependently damped circadian gene expression in the SCN. This is consistent with disruption of trans-criptional feedback rhythms. O‘Neill et al. Science, 320, 949 (2008) Modeling Cell Fate
Can cAMP stimulation be recoved? Idea: Direct activation of the effectors might compensate, therefore, for inactivation of adenylate cyclase by MDL. Observation: A hydrolysis-resistant Epac agonist transiently activated oscillations in transcriptional activity in SCN treated with MDL. O‘Neill et al. Science, 320, 949 (2008) Modeling Cell Fate
slowing cAMP synthesis Idea: if cAMP signaling is an integral component of the SCN pacemaker, altering the rate of cAMP synthesis should affect circadian period. Experiment: 9-(tetrahydro-2-furyl)-adenine (THFA) is a noncompetitive inhibitor of adenylate cyclase that slows the rate of Gs-stimulated cAMP synthesis, which attenuates peak concentrations. Interpretation: THFA dose-dependently increased the period of circadian pacemaking in the SCN, from 24 to 31 hours, with rapid reversal upon washout O‘Neill et al. Science, 320, 949 (2008) Modeling Cell Fate
Conclusions on cAMP-coupling Circadian pacemaking in mammals is sustained. Its canonical properties of amplitude, phase, and period are determined by a reciprocal interplay in which transcriptional and posttranslational feedback loops drive rhythms of cAMP signaling. Dynamic changes in cAMP signaling, in turn, regulate transcriptional cycles. Thus, output from the current cycle constitutes an input into subsequent cycles. The interdependence between nuclear and cytoplasmic oscillator elements we describe for cAMP also occurs in the case of Ca2+ and cADPR. This highlights an important newly recognized common logic to circadian pacemaking in widely divergent taxa. O‘Neill et al. Science, 320, 949 (2008) Modeling Cell Fate
Circadian regulation of epigenetic chromatin Doi, Hirayama, Sassone-Corsi, Cell 125, 497 (2006) Schematic representation of the primary structures of mouse CLOCK and human ACTR with common features; a basic helix-loop-helix (bHLH) motif (indicates binding to DNA), Per-Arnt-Sim (PAS) domains, serine-rich (S-rich) regions, a nuclear receptor interaction domain (NRID), a glutamine-rich (Q-rich) region containing a poly-glutamine (polyQ) stretch. A horizontal line above hACTR indicates a region known to have HAT activity. Modeling Cell Fate
CLOCK is a histone acetyl transferase (A) Myc-mCLOCK-specific immunopreci-pitation of HAT activity. Myc-mCLOCK or MycmBMAL1 were transiently expressed in JEG3 cells and then immunoprecipitated with antiMyc 9E10 antibody. After extensive washing, the resulting immunoprecipitates were incubated with [3H] acetyl-CoA and a mixture of histone H3 and H4 amino-terminal tail peptides. The incorporated [3H] acetate was detected by filter binding assays. As a control, cells transfected with an empty vector (mock) were also subjected to the immunoprecipitation HAT assay. Representative Western blot, illustrating the protein levels of the immunoprecipitated Myc-tagged proteins, is shown on the left.(B) In-gel HAT activities of Myc-CLOCK. Either a full-length (Full) or an N-terminally truncated (DN) mCLOCK protein was expressed in JEG3 cells and immunoprecipitated as described in (A). The immunoprecipitates were resolved on a 7.5% SDS-PAGE gel containing core histones and processed to detect acetyltransferase activity (left). Identical immunoprecipitated samples were electrophoresed in a parallel SDS-PAGE gel and immunoblotted with antiMyc 9E10 antibody (right). Doi, Hirayama, Sassone-Corsi, Cell 125, 497 (2006) Modeling Cell Fate
CLOCK is a histone acetyl transferase TOP: HAT assays using either free core histones or mononucleosomes were performed and the reaction products analyzed on SDSPAGE. The mCLOCK protein acetylatedprimarily histones H3 and H4 on both free histone andmononucleosomes,BOTTOM: Specificity of CLOCK enzymatic activity was then investigated by using H3 and H4 tails with preacetylated lysines. In this approach, putative HAT substrate sites are occupied, resulting in a block of potential de novo acetylation. Our results determined that histone H3 Lys-14, and in a lesser extent Lys-9, are themajor sites acetylated by mCLOCK. Doi, Hirayama, Sassone-Corsi, Cell 125, 497 (2006) Modeling Cell Fate
Schematic model Schematic Model of CLOCK-Mediated HistoneAcetylation and Its Role within the Physiological Pathways of Circadian Rhythmicity The HAT function of CLOCK activity is enhanced by BMAL1, its natural heterodimerization partner, with which it binds to E box promoter elements within clock gene promoters (such as per1). Acetylation by CLOCK, e.g. at H3 Lys-14, is thought to elicit chromatin remodeling by inducing a transcription-permissive state. Metabolic, nutritional, and environmental circadian cues likely modulate the HAT function of CLOCK. Doi, Hirayama, Sassone-Corsi, Cell 125, 497 (2006) Modeling Cell Fate
Current understanding: clock – chromatin - metabolites Circadian transcription is associated with rhythmic changes in epigenetic marks at circadian promoters, such as H3K4 trimethylation and H3K9 and H3K14 acetylation. The histone methyltransferase mixed-lineage leukemia 1 (MLL) contributes to the recruitment of CLOCK-BMAL1 to chromatin and thereby to the expression of clock-controlled genes. Sirtuins are a class of NAD+-dependent deacetylases. Circadian fluctuation of NAD+-levels induce rhythmicity in SIRT1 enzymatic activity. NAD+-oscillation is dictated by CLOCK-BMAL1 which control the gene Nampt, encoding the nicotinamide phosphoribosyltransferase enzyme. Aguila-Arnal et al. show that MLL1 is an acetylated protein and its enzymatic activity is controlled by SIRT1-dependent deacetylation. Aguila-Arnal et al. Nature Struct Mol Biol 22, 312 (2015) Modeling Cell Fate
CLOCK is a histone acetyl transferase Fig. (e) shows H3K4 ChIP-data for the promoter of the circadian gene Dbp. H3K4-methylation levels are modified by changing the NAD+ concentration. Aguila-Arnal et al. Nature Struct Mol Biol 22, 312 (2015) Modeling Cell Fate
Interpretation: Circadian regulation of epigenetic chromatin Dynamic cross-talk between cellular energy metabolism and chromatin regulation controls circadian rhythmicity of gene expression. Circadian fluctuations in NAD+ levels and SIRT1 activity drive oscillations of the transcriptionally activating H3K4 trimethyl mark at promoters of clock-controlled genes (CCGs). (a) At circadian times with low NAD+ levels (1), SIRT1 deacetylase activity is low, and MLL1 remains acetylated and active, increasing H3K4me3 levels at the promoters of CCGs. Acetylated MLL1 also favors recruitment of the HAT complex, CLOCK–BMAL1, and acetylation of H3K9 and H3K14 at these promoters. Together, the activating methyl and acetyl histone marks promote transcription of CCGs. Tasselli & Chua, Nat Struct Mol Biol 22, 275 (2015) Modeling Cell Fate
Interpretation: Circadian regulation of epigenetic chromatin (b) As NAD+ levels increase over time, SIRT1 is activated, and it deacetylates MLL1. This reduces the methyltransferase activity of MLL1 and thus decreases H3K4me3 occupancy at CCG promoters. This, together with SIRT1 deace-tylation of H3K9 and H3K14, results in reduced transcription of CCGs. Tasselli & Chua, Nat Struct Mol Biol 22, 275 (2015) Modeling Cell Fate
Interpretation: Circadian regulation of epigenetic chromatin (c,d) Schematic illustrating the shifting balance between SIRT1 versus MLL1 activities over circadian time. The circadian oscillations in these activities are linked to each other and to the cellular bioenergetic state via feedback loops involving cyclic production of NAD+. In conditions of low cellular NAD+ (c), the balance favors transcription dependent on MLL1 and CLOCK–BMAL1. Among the CCGs is the Nampt gene, which encodes a key enzyme in NAD+biosynthesis. Over time, as NAD+ synthesis continues, rising NAD+ levels tilt the balance back toward SIRT1 activity and transcriptional repression (d). Tasselli & Chua, Nat Struct Mol Biol 22, 275 (2015) Modeling Cell Fate