Download
1 / 13
130 likes | 228 Views
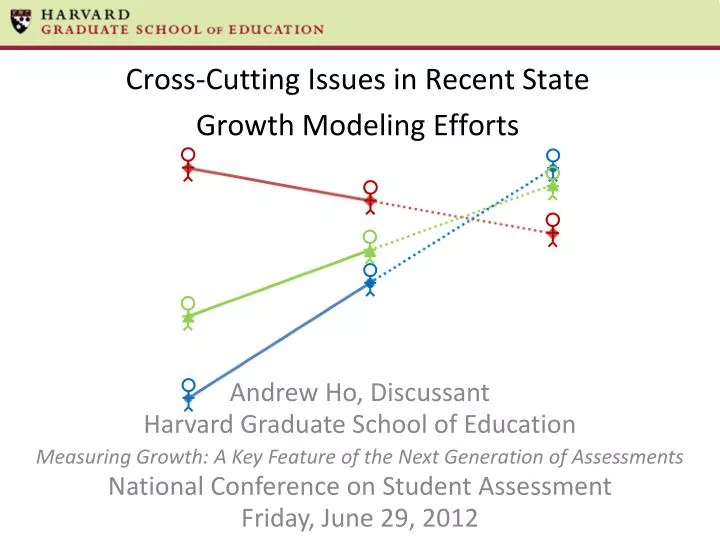
Cross-Cutting Issues in Recent State Growth Modeling Efforts. Andrew Ho, Discussant Harvard Graduate School of Education Measuring Growth: A Key Feature of the Next Generation of Assessments National Conference on Student Assessment Friday, June 29, 2012. Four Presentations.

E N D
Cross-Cutting Issues in Recent State Growth Modeling Efforts Andrew Ho, Discussant Harvard Graduate School of Education Measuring Growth: A Key Feature of the Next Generation of Assessments National Conference on Student Assessment Friday, June 29, 2012
Four Presentations • Lisa Keller’s presentation by Stephen Murphy • I’ll reflect on Lisa’s excellent overview of growth modeling issues and make some explicit recommendations. • Richard Vineyard (and Carol Crothers), Nevada • SGPs with an eye toward EVAAS • Juan Copa, Florida • Categorical + Gain … + Covariate-Adjustment VAM • Maridyth McBee, Oklahoma • Categorical … + VAM
Lisa Keller by Stephen Murphy (1) • Lisa and Stephen raise a number of critical issues: • Defining “growth,” aligning models to purposes, vertical scaling, missing data, background variables, error bands, transparency. • I might push Lisa (and many academics, including myself) to be more explicit about what to do in particular situations. • We do a lot of “sensitivity studies” that show that results differ across models. We don’t as often address why, or when Model A is better than Model B. • Not only, “here are some important issues to consider,” but also, “and if you find X or care about Y, then you must do Z.”
Castellano and Ho’s Practitioner’s Guide to Growth (1) • Shameless self-citation: Katherine Castellano (UC Berkeley) and I have a practitioner-oriented “Guide to Growth” due out this summer under CCSSO (contact me if you’re interested in a draft). • We cross-classify seven growth models by seven critical questions and criteria. • I’ll be extending our framework to discuss the growth models in Nevada, Florida, and Oklahoma. • Lisa and Stephen’s presentation does an excellent job of listing some of the issues we consider and others that we should have discussed more than we did (particularly missing data and error bands).
Practical definitions of “growth” and “growth model” • Status describes the academic performance of a student or group at a single point in time. • Growth describes the academic performance of a student or group over two or more time points. • A Growth Modelis a collection of definitions, calculations, and rules that quantifies student performance over two or more time points and supports interpretations about students, their classrooms, their educators, and their schools. • With apologies (and sympathy) to the “growth purists,” our call is to describe models as they are.
Richard Vineyard (and Carol Crothers), Nevada (2) • Nevada uses SGPs but is considering “value added” alternatives such as EVAAS. • Comments and suggestions: • Try mean SGPs instead of median SGPs. • More shameless self-citation: Katherine Castellano and I have a paper (scholar.harvard.edu/andrewho) that shows considerable advantages to means, including • much smaller theoretical standard errors • less variability in year-to-year comparisons • less scale-dependency • stronger correlations with familiar metrics. • Measurement purists will tell you that you can’t average percentile ranks. We show that a simple tweak will satisfy many of their concerns while retaining the considerable advantages of averages. • In my opinion, a move to EVAAS would improve the argument for “value-added” inferences by a small degree but sacrifice transparency and interpretability.
Juan Copa, Florida (3) • Florida uses a hybrid categorical model and gain-based model and is adding a value-added model. • The covariate-adjustment value-added model, like the SGP approach, is a “conditional status” model that does not align with “intuitive” descriptions of growth. • Adjusts for student-level and classroom-level characteristics in an attempt to compare teachers to “similar teachers” as defined by the model. • Could create some interesting incentives, where a teacher could “acquire” certain types of students to change their comparison group. • Adds to existing incentives to “acquire” students that might have artificially low prior scores.
Sidebar: Conditional Status (SGPs, some VAMs) Ratings of restaurants in Harvard and Central Square plotted on the estimated cost of dinner. The location of a restaurant with respect to the regression line is its rating compared with expectations given price. Flour Bakery is more accurately described as having higher rating than expected given cost than “high growth.”
MaridythMcBee, Oklahoma (4) • Oklahoma uses a categorical model. From our guide… Appealing Features: Transparency, communicability, simplicity. • Things to consider: • Loss of information due to coarse categories. • Selection of articulated cut scores represents an implicit vertical scale.
Value Added • Following the philosophies of many others (Braun, 2005; Reardon & Raudenbush, 2009; Rubin, Stuart, & Zanutto, 2004), I consider “value added” to describe a hypothesis, not a model. • School and teacher “effects” are akin to an average student status beyond or below expectations. • We must remember that our expectations can and should change as we base our expectations on different variables. So, too, will “effects.” • Extremes are worthy of further investigation and require convergent evidence for causal attribution.
Value Added or Cheating Added? Atlanta Journal Constitution
Value Added • Use and interpretation of “value-added” scores are far too often devoid of any theory of action for the improvement of teaching or school leadership. • In medicine, one could… • analyze data • use results to identify symptoms • consider symptoms to arrive at a diagnosis • use the diagnosis to prescribe a treatment. • With teacher value added models, we… • analyze data • use results to rank teachers on a single scale… and then? • Many states have thoughtful teacher evaluation systems for the improvement of teaching. • We might remember that VAMs are just one element in this system. Thank you! scholar.harvard.edu/andrewho Andrew_Ho@gse.harvard.edu