Download
1 / 1
10 likes | 87 Views
Cluster Recognition Program: Progress Towards An Unbiased Detection and Analysis of Clusters. Bruno Ferreira and Elizabeth Lada , University of Florida. Results

E N D
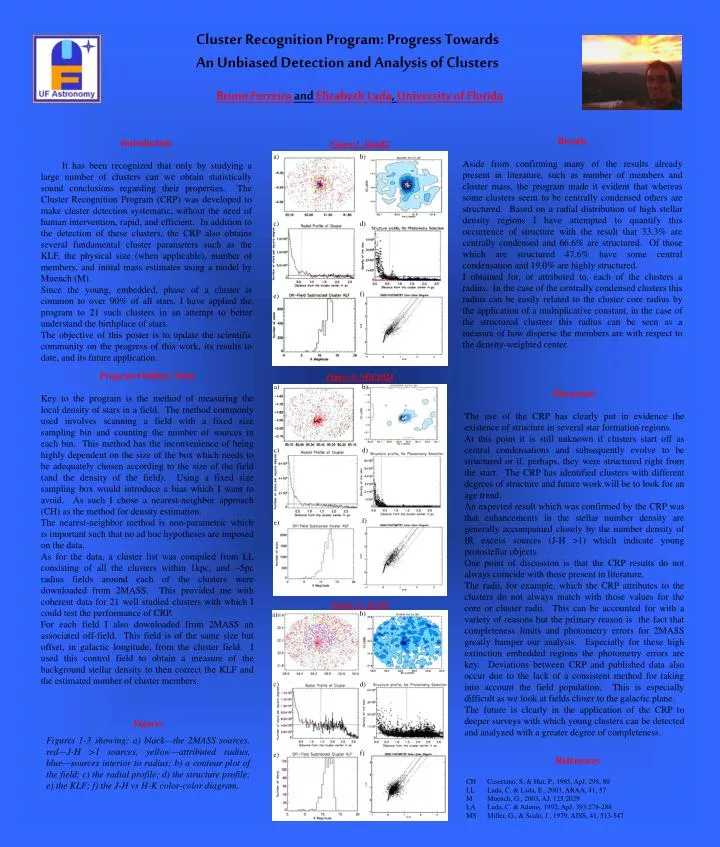
Cluster Recognition Program: Progress Towards An Unbiased Detection and Analysis of Clusters Bruno Ferreira and Elizabeth Lada, University of Florida Results Aside from confirming many of the results already present in literature, such as number of members and cluster mass, the program made it evident that whereas some clusters seem to be centrally condensed others are structured. Based on a radial distribution of high stellar density regions I have attempted to quantify this occurrence of structure with the result that 33.3% are centrally condensed and 66.6% are structured. Of those which are structured 47.6% have some central condensation and 19.0% are highly structured. I obtained for, or attributed to, each of the clusters a radius. In the case of the centrally condensed clusters this radius can be easily related to the cluster core radius by the application of a multiplicative constant, in the case of the structured clusters this radius can be seen as a measure of how disperse the members are with respect to the density-weighted center. Introduction It has been recognized that only by studying a large number of clusters can we obtain statistically sound conclusions regarding their properties. The Cluster Recognition Program (CRP) was developed to make cluster detection systematic, without the need of human intervention, rapid, and efficient. In addition to the detection of these clusters, the CRP also obtains several fundamental cluster parameters such as the KLF, the physical size (when applicable), number of members, and initial mass estimates using a model by Muench (M). Since the young, embedded, phase of a cluster is common to over 90% of all stars, I have applied the program to 21 such clusters in an attempt to better understand the birthplace of stars. The objective of this poster is to update the scientific community on the progress of this work, its results to date, and its future application. Figure 1 MonR2 a) b) c) d) f) e) Program Outline / Data Key to the program is the method of measuring the local density of stars in a field. The method commonly used involves scanning a field with a fixed size sampling bin and counting the number of sources in each bin. This method has the inconvenience of being highly dependent on the size of the box which needs to be adequately chosen according to the size of the field (and the density of the field). Using a fixed size sampling box would introduce a bias which I want to avoid. As such I chose a nearest-neighbor approach (CH) as the method for density estimation. The nearest-neighbor method is non-parametric which is important such that no ad hoc hypotheses are imposed on the data. As for the data, a cluster list was compiled from LL consisting of all the clusters within 1kpc, and ~5pc radius fields around each of the clusters were downloaded from 2MASS. This provided me with coherent data for 21 well studied clusters with which I could test the performance of CRP. For each field I also downloaded from 2MASS an associated off-field. This field is of the same size but offset, in galactic longitude, from the cluster field. I used this control field to obtain a measure of the background stellar density to then correct the KLF and the estimated number of cluster members. Figure 2 NGC2024 a) b) Discussion The use of the CRP has clearly put in evidence the existence of structure in several star formation regions. At this point it is still unknown if clusters start off as central condensations and subsequently evolve to be structured or if, perhaps, they were structured right from the start. The CRP has identified clusters with different degrees of structure and future work will be to look for an age trend. An expected result which was confirmed by the CRP was that enhancements in the stellar number density are generally accompanied closely by the number density of IR excess sources (J-H >1) which indicate young protostellar objects. One point of discussion is that the CRP results do not always coincide with those present in literature. The radii, for example, which the CRP attributes to the clusters do not always match with those values for the core or cluster radii. This can be accounted for with a variety of reasons but the primary reason is the fact that completeness limits and photometry errors for 2MASS greatly hamper our analysis. Especially for these high extinction embedded regions the photometry errors are key. Deviations between CRP and published data also occur due to the lack of a consistent method for taking into account the field population. This is especially difficult as we look at fields closer to the galactic plane. The future is clearly in the application of the CRP to deeper surveys with which young clusters can be detected and analyzed with a greater degree of completeness. c) d) f) e) Figure 3: IC348 b) a) c) d) Figures Figures 1-3 showing: a) black—the 2MASS sources, red—J-H >1 sources, yellow—attributed radius, blue—sources interior to radius; b) a contour plot of the field; c) the radial profile; d) the structure profile; e) the KLF; f) the J-H vs H-K color-color diagram. f) e) References CH Casertano, S. & Hut, P., 1985, ApJ, 298, 80 LL Lada, C. & Lada, E., 2003, ARAA, 41, 57 M Muench, G., 2003, AJ, 125:2029 LA Lada, C. & Adams, 1992, ApJ, 393:278-288 MS Miller, G., & Scalo, J., 1979, AJSS, 41, 513-547