Download
1 / 15
150 likes | 153 Views
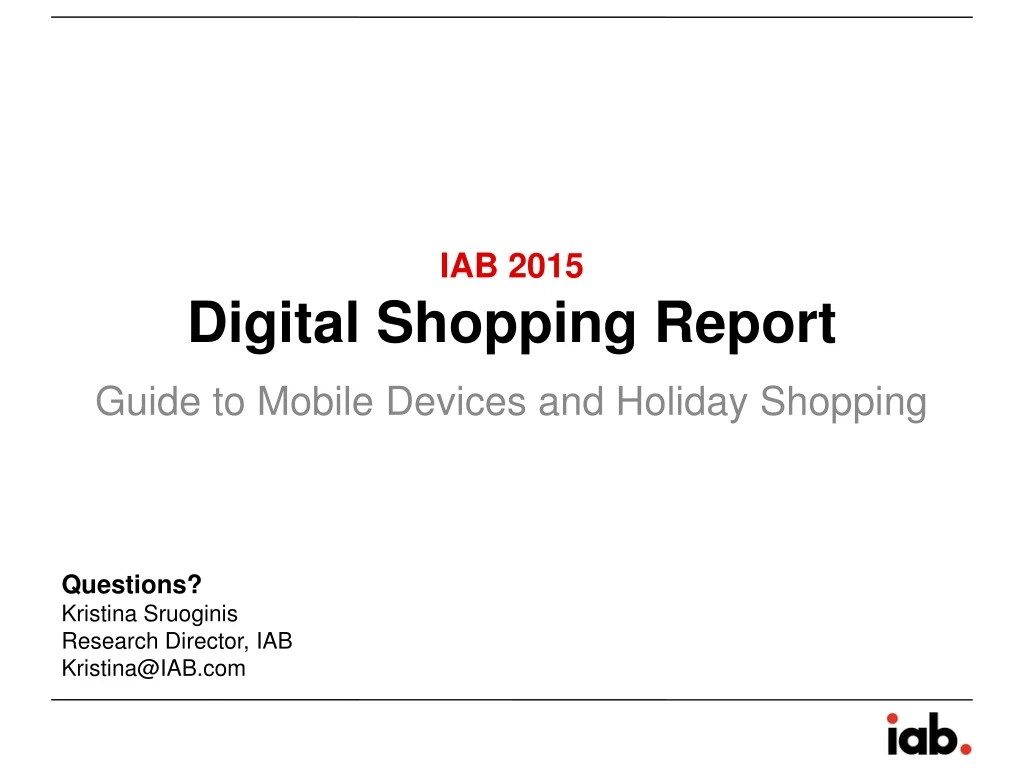
IAB 2015. Digital Shopping Report. Guide to Mobile Devices and Holiday Shopping. Questions? Kristina Sruoginis Research Director, IAB Kristina@IAB.com. Methodology.

E N D
IAB 2015 Digital Shopping Report Guide to Mobile Devices and Holiday Shopping Questions? Kristina Sruoginis Research Director, IAB Kristina@IAB.com
Methodology • IAB conducted a custom analysis of syndicated Prosper Insight data to look at consumer and media behaviors of US Adults. Adults 18 and over were compared to Adults 18-34, Adults 35-54, Adults 55-64 and Adults 65 and older. • The report is derived from the Prosper Insights & Analytics Monthly Consumer Study (October 2015) of 7276 respondents surveyed online and the annual 2015 Media Behaviors & Influence™ (MBI) Study of 16,228 respondents surveyed online. The studies have a margin of error of 1%, at a 99% confidence level. • Sample Sizes • Prosper Insights & Analytics Annual Media Behaviors & Influence™ (MBI) Study • 16,228 Adults 18+ representative of the general US population • Prosper Insights & Analytics Monthly Consumer Survey conducted online in October 2015 • 7276Adults 18+ representative of the general US 18+ population • About Prosper Insight™ • Prosper Insight delivers customized timely market intelligence from various sources through its cloud-based technology-driven Integrated Solutions Platform. Solutions are delivered on multiple devices (PC/Tablet/Smartphone) though the InsightCenter™ tool using diverse information sources relevant to clients’ business needs. www.GoProsper.com. IAB Digital Shopping Report, Nov. 2015
Summary & Implications • Different age groups shop differently. Shopping plans vary. Use of digital and mobile devices varies. Media usage also varies as does the influence it has over its users. And of course, advertising influences consumers of different age groups differently. • As we enter the holiday shopping season, it’s important to keep in mind the differences between consumers of different ages in order to better serve them and to serve them better ads. • The IAB Digital Shopping Report highlights the best ways to reach consumers of different age groups across devices and across media. • Keeping these findings in one’s back pocket when creating a media plan will assist in reaching the right consumers in the right ways. IAB Digital Shopping Report, Nov. 2015
Summary & Implications • Mobile Devices as Shopping Assistant: • Mobile: Consumers are increasingly using their mobile phones and tablets for retail related activities. Roughly half of US adults use a smartphone or tablet to browse products and about one-third use either device to comparison shop or read reviews. Tablets are preferred over smartphones for making purchases, except for adults 18-34 who prefer to buy using their smartphones. • Smartphones: Checking store logistics like location or hours is the #1 smartphone retail activity. 28% of US adults use a smartphone to make a purchase. • Tablets: Browsing for products is the #1 tablet retail activity. 35% of US adults use a tablet to make a purchase. • 18-34 year olds are most likely to use a smartphone to do any retail activity. 18-34 year olds are also more likely than any other age group to make a purchase using their smartphone (43% vs. 28% US Adults 18 and over) and more likely to purchase on a smartphone than on a tablet (35%). 18-34 year olds are more likely to read a review on their smartphone (44% vs. 32% A18+) and less likely to do so on a tablet (32%). They’re also more likely to check prices on a smartphone (42% vs. 33% A18+), and less likely to do so on a tablet (32%). • 35-54 year olds are most likely to use tablet to do any retail activity. 35-54 year olds are more likely than any other age group to make a purchase on a tablet (41% vs. 35% Adults 18+) and more likely to purchase on a tablet than on a smartphone (29%). • 55-64 year olds are more than twice as likely to make a purchase using a tablet (34%) than using a smartphone (15%). They are also most likely to use a comparison shopping app (44% vs. 41% A18+). • US adults 65 and older are more than twice as likely to make a purchase using a Tablet (26%) than using a Smartphone (11%). They’re also nearly twice as likely to read a review a using a Tablet (31%) than using a Smartphone (17%) IAB Digital Shopping Report, Nov. 2015
Summary & Implications • Showrooming: • Showrooming: Half of US Adults do some form of showrooming, defined in this study as comparing prices on a mobile device while in a retail store before purchasing. The most likely outcome of the typical adult US showroomer after checking prices is to buy in a physical store – whether at the current retailer’s or another retailer’s store. The next likely scenario is to buy from another store’s website (either on their mobile phone or a computer after leaving the store). Younger Americans are more likely to buy at another store; older Americans are more likely to buy at the same store. • 18-34 year olds are more likely to do any mobile showrooming. Over two-thirds do some form of showrooming. They are most likely to buy at another store by any means (physical store, using a mobile device or using a computer after leaving). • Over half of 35-54 year olds showroom. They have an equal likelihood of buying in the store or a competitor’s store. Their next most likely outcome is to buy from another’s website on a device or on a computer. • Over one-third of 55-64year olds showroom. They are most likely to buy at the same physical store and their next most likely scenario is to buy elsewhere on a computer after leaving. • Over one in five US adults 65 and older does showrooming. They are most likely to buy at the same physical store and least likely to buy using a mobile device while in the store. IAB Digital Shopping Report, Nov. 2015
Smartphones vs. Tablets • Checking Store Logistics Like Location or Hours is the #1 Smartphone Activity • Browsing for Product is #1 Tablet Activity • 18-34 Year Olds are Most Likely to Use Smartphone to do Any Retail Activity • 35-54 Year Olds are Most Likely to Use Tablet to do Any Retail Activity Top Retail Activities on Smartphones and Tablets: A18+ A18-34 A55-64 A65+ A35-54 • Most Likely to do Any Retail Activity on a Smartphone • MoreLikely thanotherage groups to Make a Purchase Using a Smartphone • Roughly Half of US Adults Use a Smartphone or Tablet to Browse Products andabout One-Third use eitherDeviceto Comparison Shop or Read Reviews. • Consumers are much more likely to make a purchase on a tablet and check store hours/locations on a smartphone • More than Twice as likely to make a purchase using a Tablet (34%) than using a Smartphone (15%) • Most Likely to doAny Retail Activity on a Tablet • Most Likely to Make Purchase on a Tablet • More than Twice as likely to make a purchase using a Tablet (26%) than using a Smartphone (11%) • Nearly Twiceas likely toread a review ausing a Tablet (31%) than using a Smartphone (17%) Use a Tablet: Do you use your Tablet for any of the following activities? (Check all that apply) Use a Smartphone: Do you use your Smartphone for any of the following activities? (Check all that apply) 2% difference is statistically significant IAB Digital Shopping Report, Nov. 2015
Smartphone as Shopping Assistant Top Smartphone Retail Activities Vary by Age Group A18+ A18-34 A55-64 A65+ A35-54 Percent Who Use Smartphone to: 58% Locate Store/Hours, Browse Products 53% Locate Store/ Check Hours • 49% • Locate Store/Hours • 55% • Locate Store/Hours • 43% • Locate Store/Hours • 36% • Check Price • 43% • Make Purchase • 44% • Read Reviews • 41% • Get Text Offers • 50% • Browse for a Product 35% Browse Products, Text Offers • 54% • Browse Products • 44% • Browse Products • 38% • Get TextOffers 21% ScanCoupons 33% Check Price/ ComparisonShop 19% Check Price 44% Get TextOffers • 42% • Text Offers,Check Price • 26% • Check Price 32% Read Reviews 17% Reviews, QR Code 34% ReadReviews • 33% • Scan Coupons • 24% • ReadReviews • 28% • Scan Coupons, • Make Purchase Use a Smartphone: Do you use your Smartphone for any of the following activities? (Check all that apply)2% difference is statistically significant IAB Digital Shopping Report, Nov. 2015
Tablet as Shopping Assistant Top Tablet Retail Activities Vary by Age Group A18+ A18-34 A55-64 A65+ A35-54 Percent Who UseTabletto: 52% Browse for a Product • 53%Browse Products • 56%Browse Products 48%Browse Products • 48%Browse Products • 35% • Make Purchase • 27% • Research Products • 35% • Locate Store/Hours, Check Prices, Make Purchase • 41% • Make Purchase • 31% • Read • Reviews • 36% • Read • Reviews • 39% • Read • Reviews • 40% • Read Review, Store/Hours, Check Price • 38% • Check Prices • 30% • Locate Store/Hours • 32% • Read Review, Store/Hours, Check Price 28% Check Prices • 37% • Locate Store/Hours • 21% • Research Products 26%Research Specific Products • 26% • Make • Purchase • 14% • WriteReview • 15% • WriteReview • 34% • Make • Purchase • 13% • WriteReview Use a Tablet: Do you use your Tablet for any of the following activities? (Check all that apply)2% difference is statistically significant IAB Digital Shopping Report, Nov. 2015
Older Consumers More Likely to Use Comparison Shopping Apps A18+ A18-34 A55-64 A65+ A35-54 Percent Who Use Comparison Shopping Apps on a Smartphone: 39% Use a Comparison Shopping App 44% Most Likely to Use a Comparison Shopping App 41% Use a Comparison Shopping App 41% Use a Comparison Shopping App 41% Use a Comparison Shopping App #1 30% Amazon Price Check 26% Amazon Price Check #3 #4 • 21% • Amazon Price Check 30% Amazon Price Check 24% Amazon Price Check 9% PriceGrabber 10% PriceGrabber 8% PriceGrabber 10% RedLaser 9% PriceGrabber 9% RedLaser 9% RedLaser 9% RedLaser 8% RedLaser 8% Other App #6 4% Other App 2% Other App 5% OtherApp 4% OtherApp 6% PriceGrabber Comparison Shop with Tablet: Which of the following price comparison apps do you use on your Tablet? (Check all that apply)2% difference is statistically significant IAB Digital Shopping Report, Nov. 2015
ShowroomingHalf of US Adults Compare Prices on Mobile While in StoreMost Will Then Buy in a Physical Store • Half of US Adults do some form of showrooming • Typical ‘showroomer’ is most likely to buy in physical store – equal chance at current retailer’s or competitor’s store • Nextchoice is to buy from another store’s website - via mobile or computer Do you do any of the following on your smartphone or tablet while shopping in a store US Adults 18 and Older How often do you do any of the following on your smartphone or tablet while shopping in a store? Compare prices and purchase from… (Regularly/Occasionally) 2% difference is statistically significant IAB Digital Shopping Report, Nov. 2015
ShowroomingOver Two-Thirds of 18-34 Year Olds Compare Prices on Mobile While in StoreMost Will Then Buy from Another Retailer • Most Likely to Buy Elsewhere by any means: Physical store, using a mobile device or on a computer • Morelikely to buy on a mobile device while in store than on a computer after leaving Do you do any of the following on your smartphone or tablet while shopping in a store US Adults 18-34 Years Old How often do you do any of the following on your smartphone or tablet while shopping in a store? Compare prices and purchase from… (Regularly/Occasionally) 2% difference is statistically significant IAB Digital Shopping Report, Nov. 2015
ShowroomingOver Half of US Adults 35-54 Compare Prices on Mobile While in StoreMost Will Then Buy in any Physical Store • Equal likelihood of buying in currentretailer’s store or competitor’s store • Nextmost likely action is to buy from another retailer’s website either on a mobile device or on a computer after leaving Do you do any of the following on your smartphone or tablet while shopping in a store US Adults 35-54 Years Old How often do you do any of the following on your smartphone or tablet while shopping in a store? Compare prices and purchase from… (Regularly/Occasionally) 2% difference is statistically significant IAB Digital Shopping Report, Nov. 2015
ShowroomingOver One-Third of US Adults 55-64 Compare Prices on Mobile While in StoreMost Will Then Buy in the Same Retailer’s Physical Store • Most Likely to buy at same physical store • Nextmost likely activity is to buy elsewhere on a computer after leaving • Least likely to buy at same store on mobile device Do you do any of the following on your smartphone or tablet while shopping in a store US Adults 55-64 Years Old How often do you do any of the following on your smartphone or tablet while shopping in a store? Compare prices and purchase from… (Regularly/Occasionally) 2% difference is statistically significant IAB Digital Shopping Report, Nov. 2015
ShowroomingOver One-Fifth of US Adults 65 and OlderCompare Prices on Mobile While in StoreMost Will Then Buy in the Same Physical Store • Most likelyto buy at current Physical Store • Next choice is to buy from another retailer’s physical store orany store on a computer after leaving • Least likely to buy at any store on a mobile device Do you do any of the following on your smartphone or tablet while shopping in a store US Adults Age 65 and Older How often do you do any of the following on your smartphone or tablet while shopping in a store? Compare prices and purchase from… (Regularly/Occasionally) 2% difference is statistically significant IAB Digital Shopping Report, Nov. 2015
IAB 2015 Digital Shopping Report Guide to Mobile Devices and Holiday Shopping Questions? Kristina Sruoginis Research Director, IAB Kristina@IAB.com