Download
1 / 53
530 likes | 546 Views
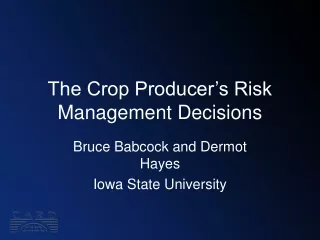
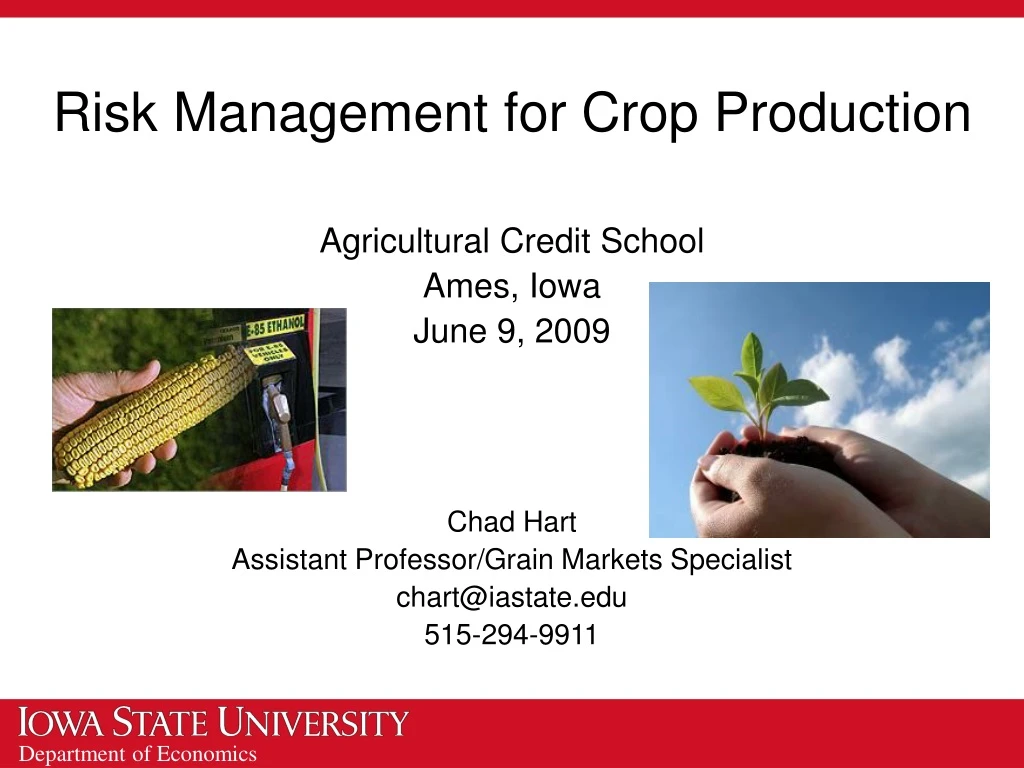
Risk Management for Crop Production. Agricultural Credit School Ames, Iowa June 9, 2009 Chad Hart Assistant Professor/Grain Markets Specialist chart@iastate.edu 515-294-9911. Iowa Corn Prices vs. Costs. 2009 Futures-based Season-average Price Estimate $4.35

E N D
Risk Management for Crop Production Agricultural Credit School Ames, Iowa June 9, 2009 Chad Hart Assistant Professor/Grain Markets Specialist chart@iastate.edu 515-294-9911
Iowa Corn Prices vs. Costs 2009 Futures-based Season-average Price Estimate $4.35 Latest USDA U.S. 2008 Season-average Price Estimate $4.20 Latest USDA Iowa 2008 Season-average Price Estimate $3.95 Preliminary estimates for 2009 costs are over $4 per bushel. Source: USDA-NASS and Duffy and Smith, http://www.extension.iastate.edu/agdm/crops/pdf/a1-21.pdf
Iowa Soybean Prices vs. Costs 2009 Futures-based Season-average Price Estimate$10.00 Latest USDA U.S. 2008 Season-average Price Estimate $9.85 Latest USDA Iowa 2008 Season-average Price Estimate $9.65 Preliminary estimates for 2009 costs are nearly $10 per bushel. Source: USDA-NASS and Duffy and Smith, http://www.extension.iastate.edu/agdm/crops/pdf/a1-21.pdf
Crop Insurance One of many risk management strategies Traditionally set up to protect farmers in times of low crop yields Also offers coverage for low prices Available on over 100 commodities
Crop Insurance Subsidies Coverage LevelSubsidy % 50% - 55% 67% 55% - 65% 64% 65% - 75% 59% 75% - 80% 55% 80% - 85% 48% > 85% 38%
Types of Crop Insurance Individual Yield (APH) Area Yield (GRP) Individual Revenue (CRC, IP, RA) Area Yield - Individual Revenue Combination (GRIP)
Individual Yield Insurance (APH) Farmer chooses percentage of expected yield to insure • Expected yield measured by average yield Price at which the crop is valued is set up front and does not change In 2008, 1.38 million acres of Iowa corn and 1.09 million acres of Iowa soybeans were covered with an APH policy
Individual Revenue Insurance(CRC, IP, RA) Farmer chooses percentage of expected revenue to insure • Expected revenue measured by average yield times initial crop price Price at which the crop is valued can move with price changes in the market Final value of the crop determined by average futures prices over harvest period
Individual Revenue Insurance(CRC, IP, RA) CRC and RA have a “harvest price option” If the harvest price is greater than the planting price, then the harvest price is used in all calculations In 2008, 9.64 million acres of Iowa corn and 7.21 million acres of Iowa soybeans were covered with individual revenue policies
Iowa Crop Insurance Figures Average producer-paid crop insurance premium in Iowa - Corn $22.66/acre - Soybeans $17.58/acre Most typical coverage - Both crops 75% RA
Iowa Crop Insurance Figures Average crop insurance liability in Iowa - Corn $640.08/acre - Soybeans $459.79/acre Total Iowa crop insurance producer-paid premiums - 2007 $279 million - 2008 $423 million
Average Producer-Paid Premiums For RA, APH and CRC graphs would look similar
Iowa Crop Insurance Payouts (As of 5/26/09) Crop insurance indemnities for Iowa thus far = $1.09 billion Every county in Iowa has received at least $3 million in crop insurance payments. Source: USDA-RMA, Summary of Business reports
Farm Bill Twist Starting in 2009, farmers will need to participate fully in crop insurance and non-insured crop assistance programs to qualify for the federal government’s new disaster assistance program (SURE) SURE guarantees and payments are tied to crop insurance decisions
Supplemental Revenue Assistance Payments Program (SURE) • Provides payments to producers in disaster counties for crop losses • Based on crop insurance program, non-insured crop assistance program, and disaster declarations • Whole-farm revenue protection, not commodity-specific
SURE Triggers • Declared “disaster county” by Secretary of Agriculture or contiguous to one • Farm with losses exceeding 50% of normal production in a calendar year • One crop must have at least a 10% yield loss
SURE Settings • Participation and revenue guarantee tied to crop insurance (for all crops that represent at least 5% of the farm’s crop value) • Farm revenue, including some government payments, used to determine payment • Payments set as 60% of the difference between guarantee and actual revenue • Limited to $100,000 per producer • Payments not known or paid until the end of the marketing year
SURE Guarantee Farm guarantee is the sum of 115%*Crop insurance price election*Crop insurance coverage level*Planted acres* Max(APH or CCP yield), for insurable commodities 120%*NCAP price election*Planted acres* Max(NCAP or CCP yield), for non-insurable commodities For an individual crop, the guarantee can not be greater than 90% of the crop’s expected revenue
SURE Expected Farm Revenues Expected farm revenue is the sum of Max(APH or CCP yield)*Planted acres*100% of the crop insurance price for insurable commodities 100% of NCAP yield*100% of NCAP price*Planted acres for non-insurable commodities
SURE Actual Farm Revenues Actual farm revenue is the sum of Harvested acres*Farm yield*National season-average price for all commodities 15% of direct payments All CCP or ACRE payments All marketing loan benefits All crop insurance or NCAP payments Any other disaster assistance payments
SURE Calculator USDA has created a calculator for SURE http://www.fsa.usda.gov/Internet/FSA_File/sure_calculator.xls http://www.fsa.usda.gov/Internet/FSA_File/calculator_instructions.pdf ISU Extension information on SURE http://www.extension.iastate.edu/agdm/crops/html/a1-44.html http://www.extension.iastate.edu/agdm/crops/xls/a1-44surecalculator.xls
Average Crop Revenue Election (ACRE) • ACRE is a revenue-based counter-cyclical payment program • Based on state and farm-level yields per planted acre and national prices • Producers choose between the current price-based counter-cyclical payment (CCP) program and ACRE
Farmer Choice • Starting in 2009, producers will be given the option of choosing ACRE or not • Can choose to start ACRE in 2009, 2010, or beyond • Once you’re in ACRE, you stay in ACRE until the next farm bill • If you sign up for ACRE, you must do so for all eligible crops • Deadline for sign-up, Aug. 14 (this year) • Producers choosing ACRE agree to 20% decline in direct payments and 30% decline in loan rates
ACRE Settings ACRE is based on planted acres Total acres eligible for ACRE payments limited to total number of base acres on the farm Farmers may choose which planted acres are enrolled in ACRE when total base area is exceeded
Loan Rates under ACRE Corn $1.365 Soybeans $3.50 Current Loan Rates Corn $1.95 Soybeans $5.00
Average Direct Payments Per Payment Acre for Iowa Please note the 83.3 or 85% rule has not been yet to these payments.
ACRE • Program has state and farm trigger levels, both must be met before payments are made • Expected state and farm yield based on 5 year Olympic average yields per planted acre • ACRE price guarantee is the 2 year average of the national season-average price
ACRE Set-up for Iowa Corn The 2008 yield and price are USDA’s May 2009 estimates. So the expected state yield would be 171.0 bushels per acre and the ACRE price guarantee would be $4.20 per bushel.
ACRE Structure ACRE revenue guarantee = 90% * ACRE price guarantee * Expected state yield For our example, the ACRE revenue guarantee is 90% * $4.20/bu. * 171.0 bu./acre $646.38/acre ACRE actual revenue = Max(Season-average price, ACRE Loan rate) * Actual state yield per planted acre
ACRE Structure ACRE Farm revenue trigger = Expected farm yield * ACRE price guarantee + Producer-paid crop insurance premium Let’s assume farm yields equal to state yields and use the average producer-paid crop insurance premium for 2008 171.0 bu./acre * $4.20/bu. + $22.66/acre $740.86/acre
ACRE Payment Triggers ACRE actual farm revenue = Max(Season-average price, ACRE Loan rate) * Actual farm yield per planted acre Given our example, ACRE payments are triggered when ACRE actual revenue is below $646.38/acre and ACRE actual farm revenue is below $740.86/acre
ACRE Payments • Payment rate = Min(ACRE revenue guarantee – ACRE actual revenue, 25% * ACRE revenue guarantee) • Payments made on 83.3% of planted acres in 2009-11, 85% in 2012 (up to total base) • ACRE payment adjustment: Payment multiplied by ratio of Expected farm yield to Expected state yield
ACRE Payment Timing Payments can begin as soon as practicable possible after the end of the marketing year So 2009 ACRE payments could start to be paid out in October 2010 There are no provisions for advance payments
ACRE vs. CCP CCP pays No CCP payments No ACRE payments ACRE pays out
Looking Beyond 2009 The ACRE revenue guarantee is updated each year using the same rules 5 year Olympic average for yields 2 year average for prices But the ACRE revenue guarantee can not change by more than 10 percent (up or down) from year to year So if the 2009 ACRE revenue guarantee is $646.38, then the 2010 ACRE revenue guarantee must be between $581.74 and $711.02
An Example for 2009 To start, we need the expected state and farm yields and the ACRE price guarantee Expected state yield 171 bu/acre Expected farm yield 180 bu/acre 2004-08 Olympic average of yields per planted acre ACRE price guarantee $4.20/bu Average of 2007 and 2008 season-average prices ACRE Revenue Guarantee $646.38 90% * $4.20/bu * 171 bu/acre ACRE Farm Revenue Guarantee $776.00 $4.20 * 180 bu/acre + $20/acre
Example (continued) For 2009, we need the actual state yield, the actual farm yield , and the season-average price Actual state yield 165 bu/acre Actual farm yield 190 bu/acre Season-Average Price $3.50/bu ACRE Actual Revenue $577.50 $3.50/bu * 165 bu/acre ACRE Farm Actual Revenue $665.00 $3.50/bu * 190 bu/acre
Example (continued) State Trigger ACRE Revenue Guarantee $646.38 ACRE Actual Revenue $577.50 So we’ve met the state trigger • Farm Trigger • ACRE Farm Revenue Guarantee $776.00 • ACRE Farm Actual Revenue $665.00 • So we’ve met the farm trigger
Example (continued) ACRE Payment $60.40 Min(25%*$646.38, $646.38 – $577.50) * (180 bu/acre / 171 bu/acre) * 83.3%
Farmer’s Choice In deciding about ACRE, farmers must weigh: The loss of 20% of their direct payments, a 30% drop in the marketing loan rate, and no access to CCP payments versus The potential for payments under ACRE
Comparing Program Parameters For Iowa Corn Under the current CCP program CCP Yield Average = 122.1 bushels per acre CCP Effective Target Price = $2.35/bushel In our example, for ACRE ACRE Yield Guarantee = 171.0 bushels per acre ACRE Price Guarantee = $4.20/bushel 20% of average Iowa corn direct payment = $6.50 per acre
Farmers Have Some Time to Decide ACRE signup started in April, will end in August Preliminary ACRE information and tools are available at: http://www.extension.iastate.edu/agdm/crops/html/a1-45.html http://www.fsa.usda.gov/FSA/webapp?area=home&subject=dccp&topic=landing http://www.farmdoc.uiuc.edu/fasttools/index.asp
Forms and Records Forms Election: CCC-509 ACRE (fill out once) Enrollment: CCC-509 (fill out each year) If you do not fill out the enrollment paperwork, you are not in the program All producers, including landowners, must sign the election form Records Must annually report acreage and production to FSA In proving historical farm yields, producers must present production records for continuous years (no gaps are allowed)
Forms and Records Records The farm yields will be the higher of the proven farm yield or 95% of the county average yield determined by FSA (NASS county production/FSA county acreage) Zero production reports are allowed Crop insurance and NAP production reports will work Commercial receipts, settlement sheets, warehouse ledger sheets that are reliable and/or verifiable will work Loan and LDP records will work