Download
1 / 34
350 likes | 535 Views
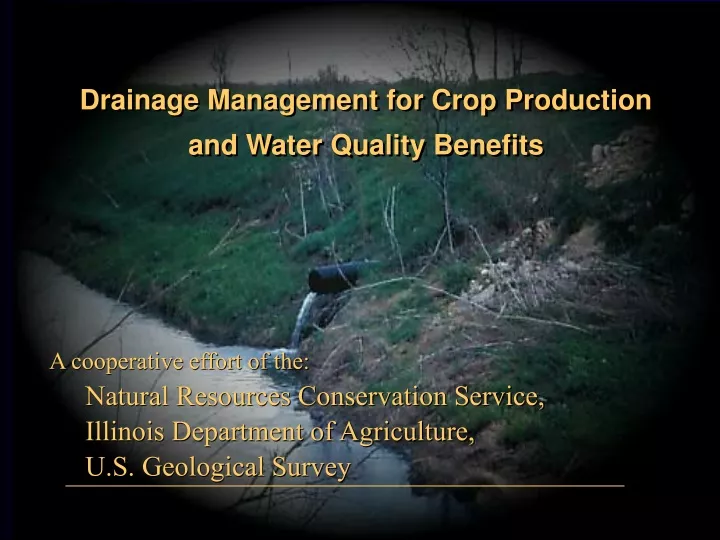
Drainage Management for Crop Production and Water Quality Benefits. A cooperative effort of the: Natural Resources Conservation Service, Illinois Department of Agriculture, U.S. Geological Survey. Midwest Subsurface Drained Farmland. Midwest total > 50 million acres.

E N D
Drainage Management for Crop Production and Water Quality Benefits A cooperative effort of the: Natural Resources Conservation Service, Illinois Department of Agriculture, U.S. Geological Survey
Midwest Subsurface Drained Farmland Midwest total > 50 million acres
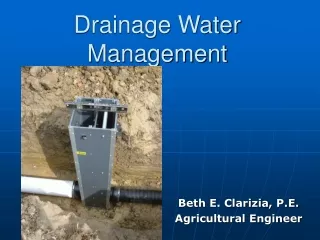
Benefits of Subsurface Drainage • Many of the most agriculturally productive soils in Illinois require subsurface drainage for economic crop production • Subsurface drainage allows for improved soil aeration and increased crop production • Subsurface drainage allows for field access with equipment cultivation, planting, harvesting, etc.
Current Situation • Many tile systems are old and are subject to being replaced. • Yield monitors on combines are showing growers the benefits for more intensive drainage • Economics forces then dictate improving existing drainage systems to increase production
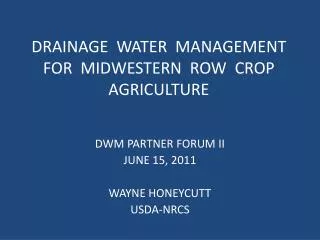
Current Trend • “Patterned” systems replacing “random” systems • Trend toward more extensive drainage of existing farm fields • New systems should be designed with drainage management in mind
Water Quality Impacts(Nitrate in Surface Water) Local concern • drinking water supplies cannot exceed (10 mg/l) Regional concern • stream and reservoirs with elevated nitrate levels are contributing to eutrophication problems, along with drinking water problems National concern • Gulf of Mexico Hypoxia
Problem Statement Tile Drainage is: 1) Needed for economical crop production 2) Primary source of nitrate to surface water
Possible Solutions 1) Reduce the amount of N applied for crop production (source reduction) • follow recommended guidelines 2) Practice drainage management (effect the transport process) • only release tile water when it is necessary
Possible Solutions 1) Reduce the amount of N applied for crop production (source reduction) • follow recommended guidelines 2) Practice drainage management (effect the transport process) • only release tile water when it is necessary
Nitrate Loss in Subsurface Drainage as Affected by Nitrogen Fertilizer RateJaynes et al., USDA-ARS, National Soil Tilth Lab, Ames, Iowa, August 2000 “…economic corn production cannot be sustained within this field under the current rotation and management scheme without producing tile drainage water that exceeds the MCL for NO3. The problem is not simply one of N fertilizer use, but of a corn-soybean production system created by artificial soil drainage and intensive tillage.”
MCL Unpublished Data: K. Smiciklas, ISU (Lake Bloomington Project) Nitrate Concentrations from Tile Drains(McLean Co, IL. 1997-1998) Corn following Soybeans * new tile system
Possible Solutions 1) Reduce the amount of N applied for crop production (source reduction) • follow recommended guidelines 2) Practice drainage management (effect the transport process) • only release tile water when it is necessary
* • Approximately 50 million acres of tile-drained land in the 8 midwestern states • Approximately 10 million acres of tile-drained land in Illinois Zucker, L.A. And Brown, L.C., 1998: Agricultural Drainage: Water Quality Impacts and Subsurface Drainage Studies in the Midwest, Ohio State University Extension Bulletin 871, 40p. *Results from studies in Ohio
Zucker, L.A. And Brown, L.C., 1998: Agricultural Drainage: Water Quality Impacts and Subsurface Drainage Studies in the Midwest, Ohio State University Extension Bulletin 871, 40p.
602 Zone of influence > 20 ac 600 Water Level Control Device Solid Pipe Drainage Management System (gentle sloping topography) Field Boundary Source: Don Pitts; USDA, NRCS; Champaign, IL
Fate of Nitrogen in Tile Drained Agriculture Source: Zucker and Brown (1997)
Soil Surface 1 ft Water Table with Drainage Management 4 ft Tile Tile Drainage Management(when plants are young) Source: Don Pitts; USDA, NRCS; Champaign, IL
Soil Surface 2 ft 4 ft Water Table with Drainage Management Tile Tile Drainage Management(when plants are somewhat older) Source: Don Pitts; USDA, NRCS; Champaign, IL
Raised Water Table Crop Water Uptake Drain down Lower Water Table as Roots Develop After Planting Allow Water Table to Rise Fallow Season Fallow Season Harvest Dec 31 Planting Jan 1 Seasonal Water Table Level with Drainage Management Source: Don Pitts; USDA, NRCS; Champaign, IL
Structures Installed Structures Planned Structures Proposed Illinois Drainage Management Pilot Status Report (December 2001) 29 control structures installed 9 more planned for installation Source: Don Pitts; USDA, NRCS; Champaign, IL
Objectives Evaluate the extent to which management of tile-drainage systems can: 1) Improve crop production by providing a reserve of moisture available to crop roots during dry periods 2) Reduce the release of nitrate from agricultural fields through tile drains
Project Scope • Determine partial water and nitrogen budgets for managed and conventional row-crop fields • Calibrate and verify the Midwest version of the DRAINMOD-N model for Illinois soils • Evaluate nitrate concentrations and loads from managed and conventional tile drainage systems
Project Approach • 3 sets of paired fields: • managed drainage • conventional drainage • Monitoring for a minimum of 2 years for each pair of fields - overlap between pairs is desirable (Monitoring of first fields began in 2001)
Subsurface tile line Flow monitor and sampler Control Structure Weather Station Monitoring well 40-acre managed field 40-acre conventional field
INPUTS Precipitation Surface runoff Shallow groundwater OUTPUTS Tile flow Surface runoff Evaporation Transpiration Infiltration Shallow groundwater Water Budget
INPUTS Fertilizers Legumes Atmospheric deposition (wet and dry) Mineralization OUTPUTS Crop harvest Tile flow Surface runoff Infiltration (leaching) Volatilization Shallow groundwater Nitrate Budget
Data Collection Weather dataWater Quality -Air temperature Nitrate (30 per year) -Vapor pressure deficit Phosphorus (30 per year) -Soil temperature Nutrient suite (4 per year) -Solar radiation -Wind speed -Wind direction -Precipitation Flow data Field Information Tile drain flow Fertilizer usage Overland runoff Crop yields Cropping practices
Monitoring 1) Tile Flow 2) Water Quality Sampling 3) Meteorlogical Data 4) Water Table Level Datalogger Automatic Sampler - + Control Structure Ground surface Bubbler Water level sensor Float Water level sensor O O O Flow Water level Tile line Area / Velocity Probe Sampler intake Palmer-Bowlus Flume