Download

1 / 8
120 likes | 648 Views
Gender Division of Labor Group Project. Team Members: William Noell & Mike Goldman. Statement of The Problem:. What is the gender difference in facility in one small and one large University/College for the purpose of labor division. Hypothesis:.

E N D
Gender Division of Labor Group Project Team Members: William Noell & Mike Goldman
Statement of The Problem: • What is the gender difference in facility in one small and one large University/College for the purpose of labor division.
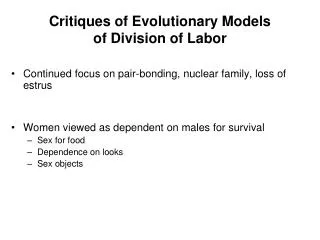
Hypothesis: • Our hypothesis is that there will be more female teachers in subjects including the arts, writing and social behaviors. • We also predict that there will be a greater number of males that teach the sciences as compared to females
Science Departments: (Biology Chemistry, Computer Science) Biology Total Faculty in Department: 8 4 Male 4 Female Percent 50% Male Percent 50% Female Chemistry Total Faculty in Department: 39 31 Male 8 Female Percent 79% Male Percent 21% Female Computer Science Total Faculty in Department: 76 62 Male 14 Female Percent 82% Male Percent 14% Female Total Breakdown Total Faculty in Department: 123 97 Male 26 Female Percent 79% Male Percent 21% Female Social Science Departments: (Art, English Literature, Creative) Social Work Total Faculty in Department: 16 2 Male 14 Female Percent 12.5% Male Percent 87.5% Female English Literature Total Faculty in Department: 78 48 Male 30 Female Percent 62% Male Percent 38% Female Creative Total Faculty in Department: 8 5 Male 3 Female Percent 62.5% Male Percent 37.5% Female Total Breakdown Total Faculty in Department: 102 55 Male 47 Female Percent 54% Male Percent 46% Female Indiana University Faculty Gender Breakdown:
Science Departments: (Biology Chemistry, Computer Science) Biology Total Faculty in Department: 15 11 Male 4 Female Percent 73% Male Percent 27% Female Chemistry Total Faculty in Department: 8 5 Male 3 Female Percent 63% Male Percent 38% Female Computer Science Total Faculty in Department: 21 17 Male 4 Female Percent 81% Male Percent 19% Female Total Breakdown Total Faculty in Department: 44 33 Male 11 Female Percent 75% Male Percent 25% Female Social Science Departments: (Art, English Literature, Creative) Art Total Faculty in Department: 13 9 Male 4 Female Percent 69% Male Percent 31% Female English Literature Total Faculty in Department: 109 58 Male 51 Female Percent 53% Male Percent 47% Female Creative Total Faculty in Department: 21 17 Male 4 Female Percent 81% Male Percent 19% Female Total Breakdown Total Faculty in Department: 143 84 Male 59 Female Percent 59% Male Percent 41% Female Roger Williams University Faculty Gender Breakdown:
Comparison of Indiana University and Roger Williams University Male vs. Female Professor Chart
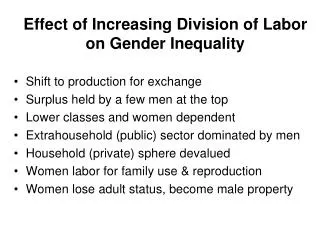
Conclusions: • There are more male then female professors overall. The biggest discrepancy is in the sciences were there are much less female then in the other disciples. But even in the Arts there are still more male professor overall than female.
References • Roger Williams University, Website: http://www.rwu.edu/ ,Date Accessed: 01/12/10 , Date Webpage Was Last Up Dated: 2009 • Indiana University, Website: http://www.indiana.edu/ ,Date Accessed: 01/12/10 , Date Webpage Was Last Up Dated: 2010