Download
1 / 12
120 likes | 125 Views
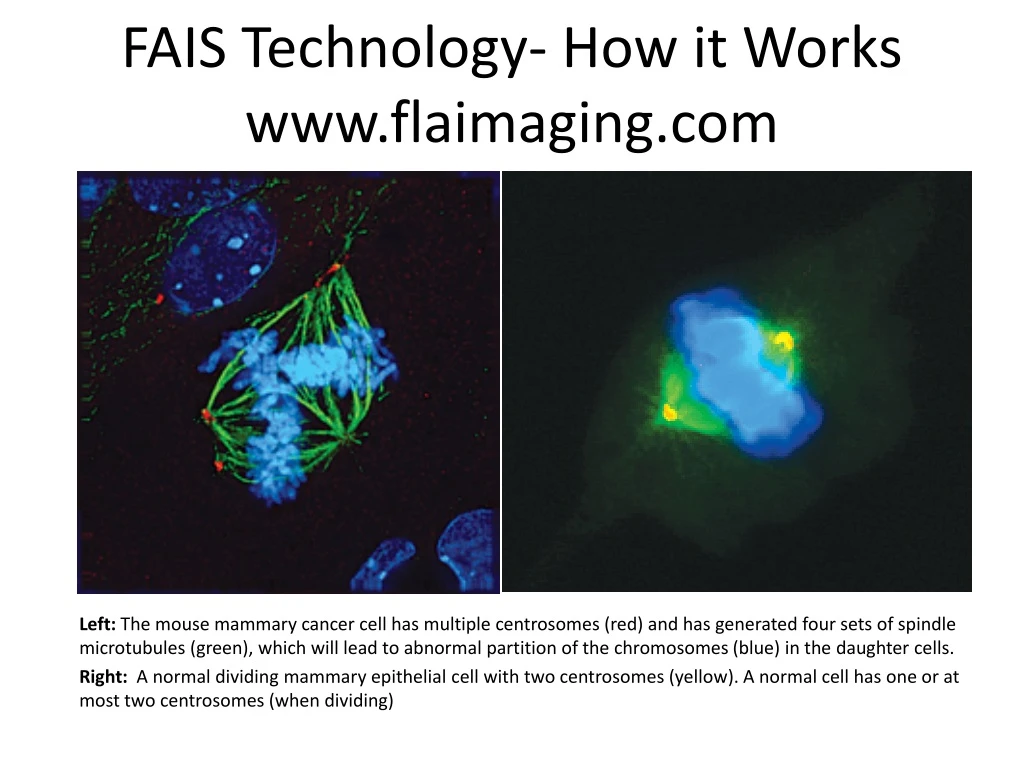
FAIS Technology- How it Works www.flaimaging.com. Left: The mouse mammary cancer cell has multiple centrosomes (red) and has generated four sets of spindle microtubules (green), which will lead to abnormal partition of the chromosomes (blue) in the daughter cells.

E N D
FAIS Technology- How it Workswww.flaimaging.com Left: The mouse mammary cancer cell has multiple centrosomes (red) and has generated four sets of spindle microtubules (green), which will lead to abnormal partition of the chromosomes (blue) in the daughter cells. Right: A normal dividing mammary epithelial cell with two centrosomes (yellow). A normal cell has one or at most two centrosomes (when dividing)
What is centrosome? • The centrosome is a small organelle located near the nucleus that plays a critical role during cell division. • Centrosome amplification in number and size and deformation in shape present in most of the common human cancers. • Centrosomal defects have been found to occur at a very early premalignant stage of tumor formation, prior to the appearance of detectable lesions. • Centrosomal defects increase in severity during tumor progression. • Therefore, centrosome is a biomarker for cancer early diagnosis, prognosis, and treatment response monitoring. It may also be a treatment target.
Future Directs Pseudo-bipolar Mitotic spindle for Chromosome Segregation Attack this mechanism to impact disease! • New direction for cancer fighting drugs – cancer cell selective, nontoxic • Example: Centrosome declustering through microtubule dynamics and multipolar spindle formation • Diagnosis & Monitoring of multiple cancer types • Treatment protocols focusing on centrosome stability • Novel drug development We propose a novel type of Lab-on-chip test for capturing and enrichment of Circulating Tumor Cells (CTC) from peripheral blood utilizing cancer molecular markers’ expression in cell,following by fluorescent imaging and automated cell centrosome image analysis for cancer prediction • Normal lung B) Lung Ca untreated C) Lung Ca treated (resemble normal cell centrosome structure) Drug untreated cancer cells show abnormal structure of centrosomes, with amplification, elongation, and fragmentation… (60 more features describing centrosome structure and stability analyzed by FAIS proprietary software for image feature analysis) for classification to confirm diagnosis and cancer prognosis with 94% specificity
Circulating tumor cells (CTC) • Heterogeneity within CTC and identification of cells with metastatic potential is a quest. Tumor cell ability for metastases may be acquired by different process of which epithelial-to-mesenchymal transition (EMT) and aberration of centrosomes are currently considered to be the main one. We propose approach to assess metastatic potential of CTCs technically unobtainable before for separation those from non-cancerous epithelial cells have been found to circulate in blood to improve cancer disease prediction. • Types of CTCs complicating the diagnosis of presence of tumor cells in blood. EMT cells not express epithelial antigens. Circulating atypical and normal cells express epithelial antigens but may be not tumor cells, or are not capable to metastases. A-B) Lung carcinoma cells spiked with blood, C D E) Circulating tumor cells A549 Lung adenocarcinoma cells’ centrosomes clearly seen (red), (blood cells are not visible in background), Lung carcinoma cells stained for γ-Tubulin (red), with DAPI nuclear stain (blue). Cancer cells showing abnormal structure of centrosomes, with amplification, elongation, fragmentation and ready for image analysis and classification tumor vs normal; C)Proplastic cell expresses epithelial antigen, cancer associated, AP stain, x1000; Require centrosome analysis to assess metastatic potential; D) Proplastic morphology ( cell not expresses epithelial antigen) FAIS technology is capable to diagnose cancer cells in blood samples, identify proliferating questionable CTCs and differentiate cells with metastatic potential
Input Image • Preprocessing (Denoising and background removal) • ROI selection • Enhancement (Contrast and resolution) • Segmentation (Isolate centrosomes and nuclei) • Feature extraction • Feature set optimization • Statistical analysis (optional) • Classification Output Diagnosis/Prognosis Result Flowchart: Primary steps of image processing
Feature Extraction Module Segmented Image Extract 240 GLCM features Extract 108 Gabor features Extract mixed 64 features First set of feature Second set of feature Third set of feature Feature extraction module includes three programs, which extracts three sets of features: The first set of features has 64 different kinds of features, which include shape, size, boundary, intensity, relationship, and transform features. The second set of features has 108 Gabor features. Gabor features are transform features. Gabor transform is also known as Short-time Fourier transform(STFT) with a Gaussian function as window function, so called Gabor transform. The third set of features has 240 gray-level co-occurrence matrix (GLCM) features. GLCM is texture information of an image obtained through calculating occurrence frequencies of difference between two pixels in a specific direction and a specific distance; therefore get comprehensive information of amplitude variation and speed in different directions and different spaces. The three sets of features can be used separately or together.
Feature Selection/Optimization First set of feature Second set of feature Third set of feature Statistical Dependency Feature Selection Mutual Information Feature Selection Genetic Algorithm Feature Selection Random Subset Feature Selection Selected/Optimized feature set Four feature selection algorithms are included. They are: • Genetic algorithm(GA) Feature Selection imitates the biological processes of reproduction and natural selection to solve for the “fittest” solutions. • Feature Selection via Mutual Information measures how much one variable tells us about another. two random variables are independent if their mutual information is zero. • Random subset feature selection (RSFS). Features are obtained by repetitively classifying the data with a KNN classifier while using randomly chosen subsets of all possible features and adjusting the relevanceof each feature according to the classification performance of the subset to get the optimized feature set. • Select features based on Statistical dependency (SD). Statistical Dependencymethod is simply to measure whether the values of a feature are dependent on the associated class labels, or whether the two simply co-occur by chance.
Classification Module ─ Training Selected/Optimized feature set Train a classifier Label SVM LDA Naïve Bayes Decision Trees KNN LSPC Trained Model After feature selection/optimization, optimized feature sets are used to train a classifier. This module includes six classifiers. They are: • Support Vector Machine (SVM) uses kernel function to transform a low dimensional sample to a higher dimensional sample, which can be separated by an optimized hyperplane. • Linear discriminant analysis (LDA) search for a linear combination of variables that best separates two classes. • Naïve Bayespredict class membership probabilities, the probability that a given sample belongs to a particular class. • Decision Treespredict a response follow the decisions in the tree from the root (beginning) node down to a leaf node. • K Nearest Neighbor (KNN) uses"k" nearest neighbors to do the classification. • Least-Squares Probabilistic Classifier (LSPC) is a probabilistic classification method that learns class-posterior probabilities.
Classification Module ─ Testing or Classification Trained Model Label Test a classifier Feature set Classification Classes Sensitivity Specificity Accurate rate After training a classifier, next step is testing the classifier or use it for classification. For testing, it needs to load the trained model, input a testing feature set and its corresponding label. The testing outputs are sensitivity, specificity, and correct rate. For classification it only needs to load the trained model and input a testing feature set. The classification output are classes, such as normal or tumor.
Deep Learning Neural Network ─ Training Segmented Image Extract & Normalize ROI Normalized ROI Deep Learning Neural Network If see Deep Learning Neural Network as a black box, The input is segmented image (ROI) and output is trained model. The right top is a normalized Region Of Interest (ROI). ROI pixels Training first layer 1st level features Training second layer 2nd level features Label Training final layer Stack all three layers ROI pixels Label Final tuning network Trained Deep Learning Model
Deep Learning Neural Network ─ Testing or Classification Trained Deep Learning Model Label Test a classifier Segmented Image Classification Classes Confusion Matrix Testing a trained Deep Learning Neural Network, it needs to load the trained Deep Learning model (the figure on top), input a testing segmented image and its corresponding label of ROIs. A confusion matrix (the figure on right) is used to report the testing performance. For classification it only needs to load the trained Deep Learning model and input a testing segmented image. The classification output are classes, such as normal or tumor.
The FAIS Solutions • Diagnosis & Monitoring of Cancer • Objective • Quantifiable- gives the physician a number • Reproducible- computerized • Standardized • Patient planning, modify treatment protocol • Develop new treatments Patient Outcome Assay