Download
1 / 18
260 likes | 607 Views
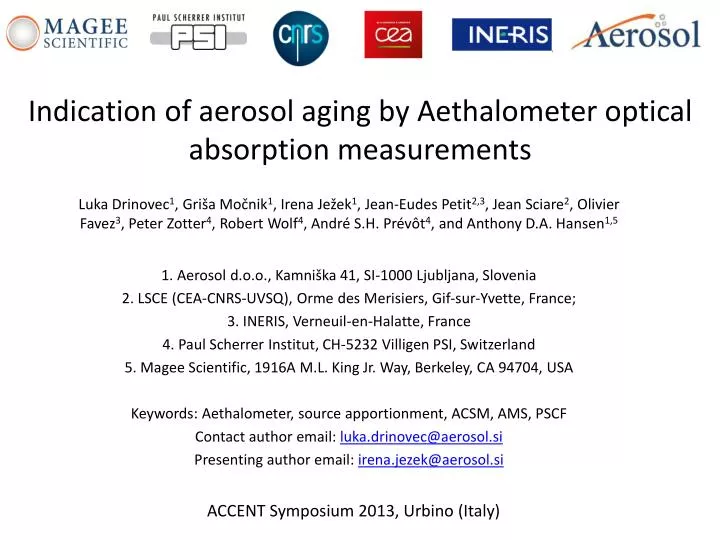
Indication of aerosol aging by Aethalometer optical absorption measurements. Luka Drinovec 1 , Griša Močnik 1 , Irena Ježek 1 , Jean-Eudes Petit 2,3 , Jean Sciare 2 , Olivier Favez 3 , Peter Zotter 4 , Robert Wolf 4 , André S.H. Prévôt 4 , and Anthony D.A. Hansen 1,5

E N D
Indication of aerosol aging by Aethalometer optical absorption measurements Luka Drinovec1, Griša Močnik1, Irena Ježek1, Jean-Eudes Petit2,3, Jean Sciare2, Olivier Favez3, Peter Zotter4, Robert Wolf4, André S.H. Prévôt4, and Anthony D.A. Hansen1,5 1. Aerosol d.o.o., Kamniška 41, SI-1000 Ljubljana, Slovenia 2. LSCE (CEA-CNRS-UVSQ), Orme des Merisiers, Gif-sur-Yvette, France; 3. INERIS, Verneuil-en-Halatte, France 4. Paul ScherrerInstitut, CH-5232 Villigen PSI, Switzerland 5. Magee Scientific, 1916A M.L. King Jr. Way, Berkeley, CA 94704, USA Keywords: Aethalometer, source apportionment, ACSM, AMS, PSCF Contact author email: luka.drinovec@aerosol.si Presenting author email: irena.jezek@aerosol.si ACCENT Symposium 2013, Urbino (Italy)
dm=472 nm dpp=20 nm Note change in scale 1. Introduction to BC measurements Sources - Combustion Effects of black carbon (BC): Public health effects Climate change How to reduce harmfull effects: Indentify sources: traffic vs household heating Indentify sources: local vs. regional
Analytical Instrument : Aethalometer™ • Collect sample continuously. • Optical absorption~ change in ATN. • Measure optical absorption continuously :λ = 370 to 950 nm. • Convert optical absorption to concentration of BC: BC (t) = babs(t) / - mass absorption crossection • Real-time data: 1 s/1 minute ATN = ln (I0 / I) babs ~ ATN Reference I0 BC Sensing I Light Detectors Light Source Filter with Sample
BC vs ATN analysis – ambient data k=0.005 k=0.001 Large loading effect Small loading effect • BC (reported) = BC (zero loading) · { 1 - k · ATN } • Linear reduction of the instrumental response due to loading of the filter fiber. Jump at the tape advance (similar to Virkkula (2007) model). • ambient data – no dependence of BC on ATN • slope k variable: site, source, aerosol age, composition • need to determine it dynamically – do not assume, rather measure
Dual spot Aethalometer – AE33 ATN2= ln (I0 /I2) BC2 Sensing I2 ATN1= ln (I0 /I1) Two parallel spots with different flow, therefore -> From different loading and attenuation loading compensation parameter k(λ) is calculated. Filter with Sample Reference I0 BC1 Sensing I1 Absorption data is compensated: babs=babs1/(1-k*ATN1) Payerne Winter 2013 Light Source Light Detectors
BC source apportionment • measure attenuation with the Aethalometer • absorption coefficient - babs • for pure black carbon: babs ~1/λ • generalize Angstrom exponent: babs ~1/λα • diesel: α ≈ 1 • wood-smoke: α ≈ 2 and higher J. Sandradewi et al., A study of wood burning and traffic aerosols in an Alpine valleyusing a multi-wavelength Aethalometer, Atmospheric Environment (2008) 101–112
BC source apportionment b(λ) = bwb (λ,wood) + bff (λ,fossil) λ = 470 nm, 950 nm bi(470 nm) / bi (950 nm) = (470 nm / 950 nm) - α= 1,0 ± 0,1 (fossil) Bond & Bergstrom 2004 α = 2,0 -0,5/+1,0 (wood) Kirchstetter 2004, Day 2006, Lewis 2008 BCwb BCff Sandradewi 2008
Paris site - SIRTA Atmospheric Research Observatory - located in a semi-urban environment - 25 km south of the Paris city center Measurement campaign Payerne site - Payerne aerological station - Rural background site - NW Swiss EMEP: summer 2012 & winter 2013
Back trajectory analysis using Potential Source Contribution Function (PSCF) • Represents the probability that an air parcel may be responsible for high concentrations observed at the receptor site • 72h back trajectories calculated with Hysplit v4.9 • starting at 500m AGL Back trajectory analysis An example: - PSCF analysis of BC - Paris winter 2013
Indentification of source locations α < 1.3 (traffic emissions) α > 1.3 (biomass burning) - Angstrom exponent α obtained from AE33 spectral data - PSCF (Back trajectory analysis using Potential Source Contribution Function) Paris – EMEP winter campaign 2013
Differentiation of fresh and aged aerosols Payerne winter Spectral fingerprint Payerne summer Summer and winter aerosols have different optical properties - k(λ) For background locations with aged aerosol loading effect at 880 nm (where BC is measured) is small!
- Compensation parameter k880nm obtained from AE33 - PSCF (Back trajectory analysis using Potential Source Contribution Function) Differentiation of fresh and aged aerosols k880nm<0.002 (aged aerosols) k880nm>0.002 (fresh aerosols) Paris – EMEP summer campaign 2012
Particle coating hypotesis Changes in k(λ) are caused by transparent coating SMPS: Fresh soot particle size = 20-50 nm Aged particle size > 100 nm Particle diameter [nm]
Coating factor (CF) – ratio between the sum of nonrefractory aerosol mass to BC: CF = (Org + NH4 + SO4 +NO3)/BC Particle coating hypotesis Aerosol mass spectrometers: ACSM & AMS (Aerodyne) -> Aerosol chemical composition is obtained
Particle coating hypotesis – summer data AE33 compensation parameter Paris Summer2012 campaign ACSM Compensation parameter k880nm and coating factor correlate well.
Spectral absorption data from Aethalometer AE33 was used for BC source apportionment during EMEP campaigns in Paris (France) and Payerne (Switzerland). Back trajectory analysis using Potential Source Contribution Function (PSCF) was used to determine fossil fuel and biomass burning locations. PSCF: Aged aerosols have small k880nm Aethalometer and ACSM/AMS measurements were used for calculation of the coating factor (CF): Big CF = Small k880nm Summary
The work described herein wasco-financed by the EUROSTARS grant E!4825 and JR-KROPgrant 3211-11-000519. Measurements performedat SIRTA (LSCE) were funded by CNRS, CEA, the EU-FP7(2007-2013) 'ATRIS' project under grant agreementn°262254, the Primequal Predit'PREQUALIF' project (ADEME contract n°1132C0020), and the DIM R2DS (AAP 2010) 'PARTICUL'AIR' project. Measurements inPayerne were conducted by the Swiss Federal Officefor the Environment (FOEN). Acknowledgements Thank you for your attention!